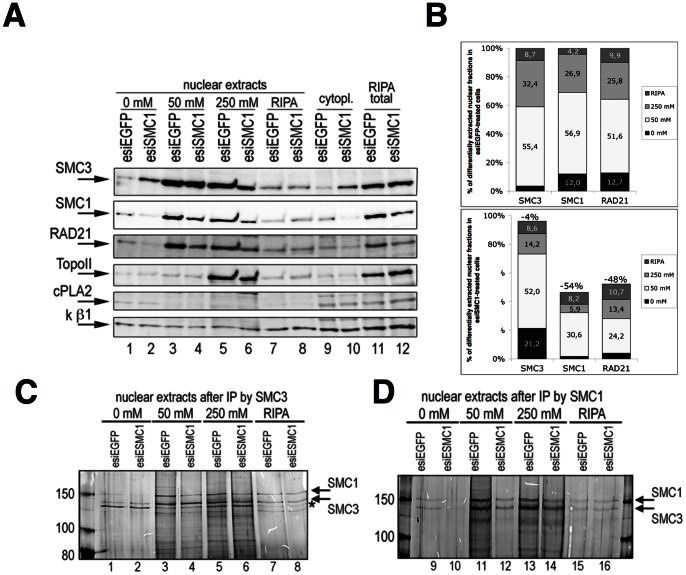
Figure 3. Differential salt extraction from control or esiSMC1-treated cells.
Representative results from three independent experiments are shown. (A) Nuclear extracts from esiSMC1 and control treated cells were prepared by successive treatment with increasing salt (0 mM, 50 mM, 250 mM ammonium sulfate) concentrations. After the last salt extraction RIPA buffer was used for the final extraction step. IB analysis for SMC3, SMC1 and RAD21 followed. Topo II was used as nuclear loading control, cPLA2 as a cytoplasmic control, and for a loading control of all fractions karyopherin (k) ß1 was used. (B) Quantification of the relative distribution of SMC1, SMC1 and RAD21 in different nuclear fractions after esiEGFP (top) or esiSMC1 (bottom) treatment as presented in A. (C) IP with anti-SMC3 or (D) anti-SMC1 antibodies was done with all fractions and eluates were examined by silver staining. The asterisk indicates the unspecific band described in 2D.

