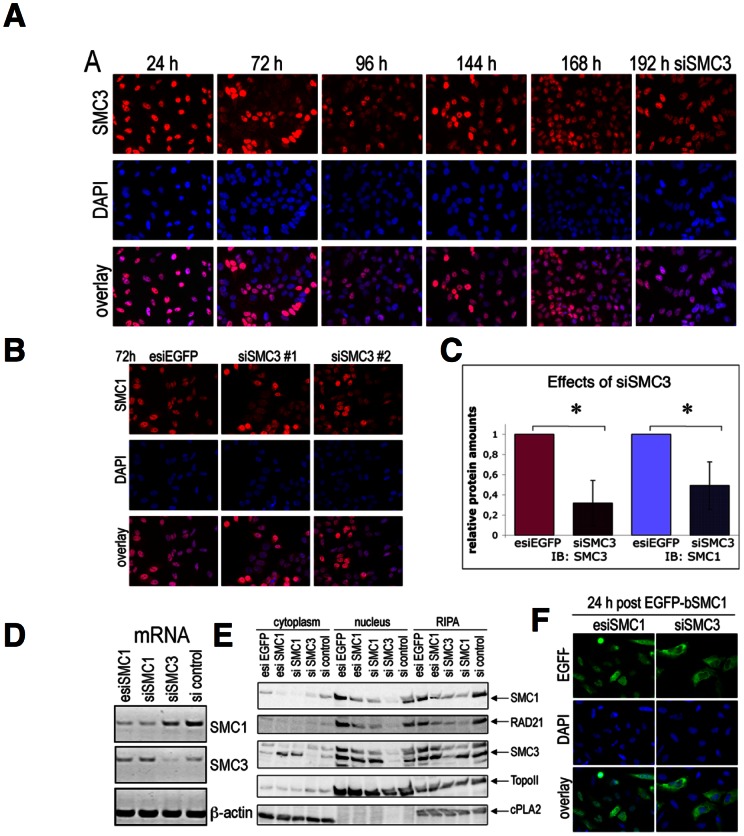
Figure 6. SMC3 knock-down by siRNA reduces the stability of SMC1.
(A) Time course of reduction and recovery of SMC3 analyzed by IF microscopy with anti-SMC3 (in red) and DAPI (in blue). (B) IF analysis using antiSMC1 antibody (in red) and DAPI (in blue). (C) Quantification of three independent IB experiments using total cell extracts (RIPA) after siSMC3 treatment. (D) Expression of mRNA of Smc1, Smc3 and ß-actin 72 h after esiSMC1, siSMC1, or siSMC3 treatment, compared to control (esiEGFP), was examined by RT PCR and agarose gel electrophoresis. (E) Cytoplasmic, nuclear and total cell extracts (RIPA) were prepared 72 h after transfection with esiEGFP, esiSMC1, siSMC1, siSMC3, or non targeting siRNA control. Protein amounts were analyzed by IB using anti-SMC1, anti-RAD21 and anti-SMC3 antibodies. Topo II was used as a nuclear control and cPLA2 as a cytoplasmic loading control. (F) 48 h after siSMC3 or esiSMC1 treatment the cells were transfected with EGFP-bSMC1 for further 24 h. The localization of EGFP-bSMC1 was analyzed by IF microscopy using anti-EGFP antibody.

