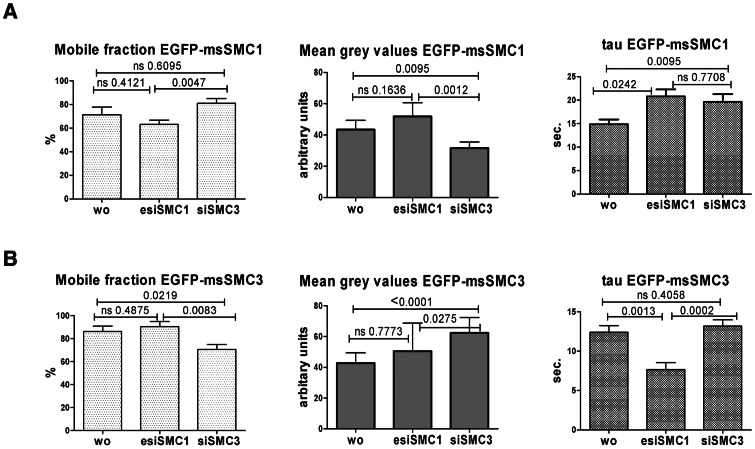
Figure 8. FRAP experiments using EGFP-msSMC1 (A) or EGFP-msSMC3 (B) as bleach substrates.
The mobile fraction (recovery), the intensity of the EGFP-tagged protein signal (given as mean grey values), and tau (τ) as a value inversely correlating with mobility are shown; ns = non significant; p-values are shown within each graph.

