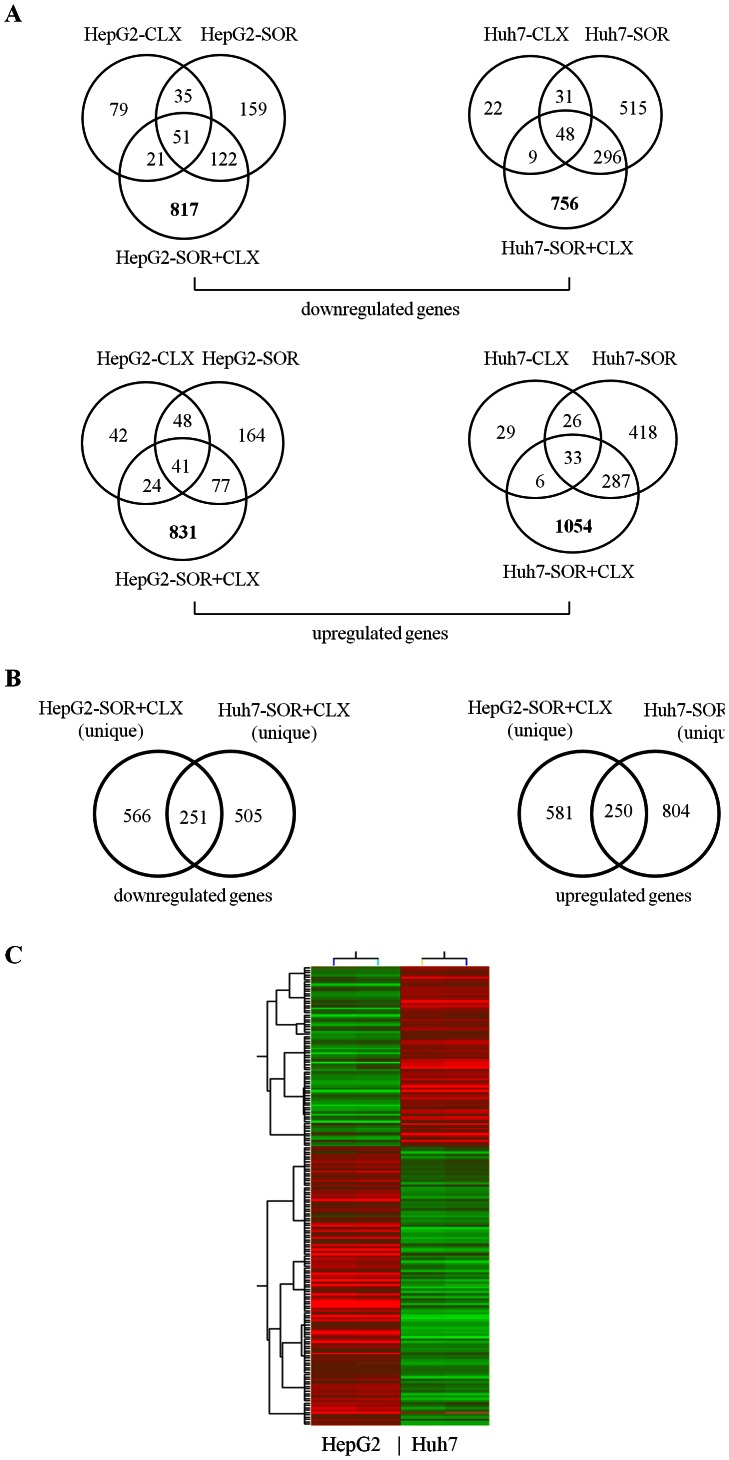
Figure 4. Comparison of common and distinct gene expressions across the various differentially- expressed gene groups in HepG2 and Huh7 cells upon celecoxib and sorafenib treatment.
(A) Venn diagram analyses of genes, differentially expressed (≥2-fold) in HepG2 and Huh7 cell lines upon CLX (50 µM) treatment, SOR (7.5 µM) treatment, and combined SOR+CLX treatment. (B) Venn diagram comparison of common and distinct genes uniquely modulated (≥2-fold) in HepG2 and Huh7 cells only following combined SOR+CLX treatment. (C) Hierarchical clustering based on the 174 genes list (2-fold difference in gene expression; p-value cutoff of 0.05) which discriminates HepG2 and Huh7 cells according to their response to combined SOR+CLX treatment. Red signifies up-regulation and green signifies down-regulation.

