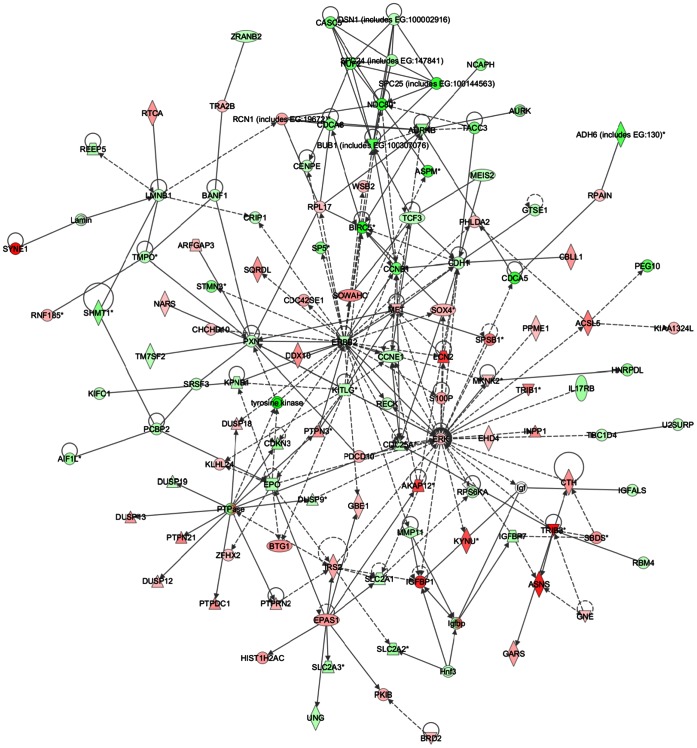
Figure 6. Network analysis of dynamic gene expression in HepG2 cells based on the 2-fold common gene expression lists obtained following combined SOR+CLX treatment.
The four top-scoring networks have been merged and are displayed graphically as nodes (genes/gene products) and edges (the biological relationships between the nodes). Intensity of the node color indicates the degree of up- (red) or down (green)-regulation. Nodes are displayed using various shapes that represent the functional class of the gene product (square = cytokine; vertical oval = transmembrane receptor; rectangle = nuclear receptor; diamond = enzyme; rhomboid = transporter; hexagon = translation factor; horizontal oval = transcription factor; circle = other). Edges are displayed with various labels that describe the nature of the relationship between the nodes: – binding only, → acts on. The length of an edge reflects the evidence supporting that node-to-node relationship and edges supported by articles from the literature are shorter. Dotted edges represent indirect interaction.

