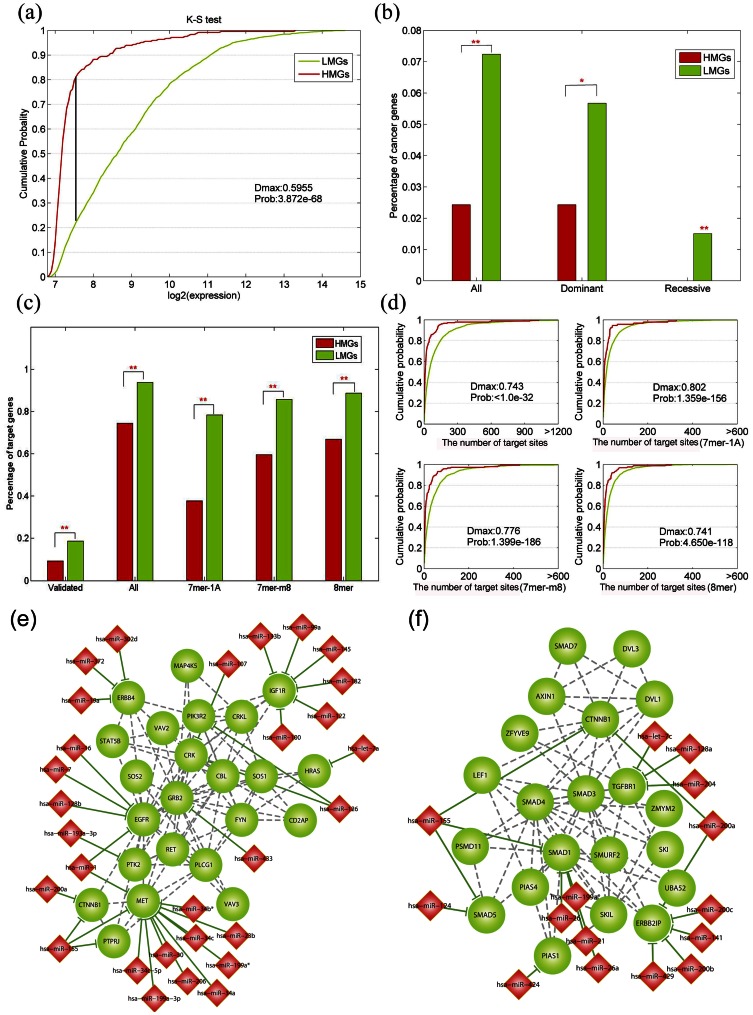
Figure 6. LMGs and HMGs are significantly different in expression pattern, functions and miRNA regulations.
(a) The cumulative distribution functions of gene expression for LMGs (green) and HMGs (red). (b) Comparison of the percentage of cancer genes. Cancer genes are further divided into dominant and recessive cancer genes according to the annotations of cancer gene census. (c) Comparison of the percentage of miRNA targets. The experimentally validated target genes have been retrieved from four manually curated databases, while the predicted miRNA targets have been collected from TargetScan and further divided into three types of targets. (d) The cumulative distribution functions of the number of miRNA target sites in LMGs (green) or HMGs (red). The maximum distance between these two distributions and the probabilities are computed by the Kolmogorov-Smirnov (K-S) test. (e) and (f) Two LMG communities that are regulated by miRNAs. The red diamonds represent miRNAs, while the green circles represent LMGs (The red stars above the bars indicate the significant levels, **p<0.01, *p<0.05).

