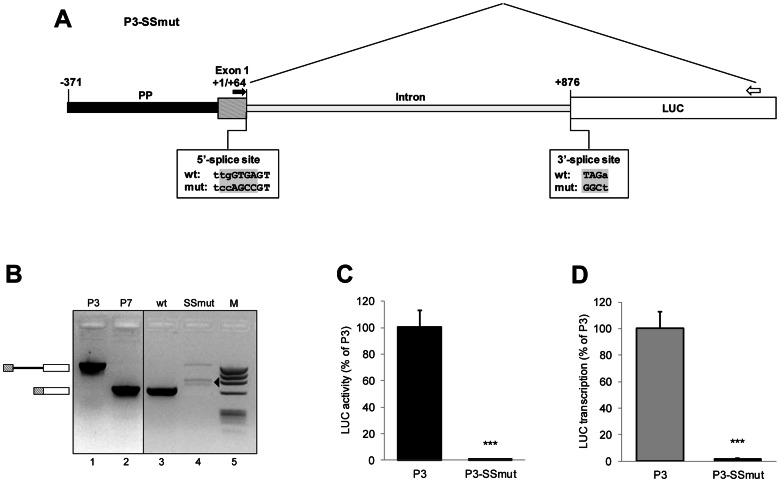
Figure 8. Effect of splice site mutations on P3-directed luciferase expression.
(A) Schematic representation of the tested P3-SSmut construct. P3-SSmut is identical to the reference construct P3, except that the sequences of the 5′ and 3′ splice sites are mutated. The wild-type and mutant splice sites are displayed below the intron boundaries and the introduced nucleotide substitutions are highlighted in gray. The primers, which bridge the intron sequence, used for assessment of splicing by RT-PCR are indicated on the illustration: the forward primer was derived from the first exon of the 5′-UTR of UbC gene (black filled arrow) and the reverse primer is complementary to the luciferase (LUC) coding region (open arrow). (B) Gel image showing the results of RT-PCR analysis. The templates were cDNAs derived from P3 (wt, lane 3) or P3-SSmut (SSmut, lane 4) transfected cells, except for samples loaded in lane 1 and lane 2, where plasmids P3 and P7 were amplified in parallel to provide the size of the PCR products expected from unspliced (1416 bp) or spliced (651 bp) transcripts, respectively. M, DNA molecular weight marker (lane 5). The boxes separated by a line (on the left) indicate the expected size of unspliced transcripts, while the two adjacent boxes indicate the size of correctly spliced transcripts. The arrowhead highlights aberrantly spliced non specific products. The analysis is qualitative, but not quantitative, that is band intensity does not accurately reflect the relative abundance of the different transcripts. (C) Relative luciferase activity and (D) quantitative RealTime RT-PCR analysis of luciferase mRNA level from HeLa cells transfected with P3-SSmut or the wild-type construct P3. Data shown in the histograms are the means (±SE) of five independent experiments. Statistical analysis (t-test) revealed a highly significant difference (***, p<0.001) between P3- and P3-SSmut-directed luciferase expression.

