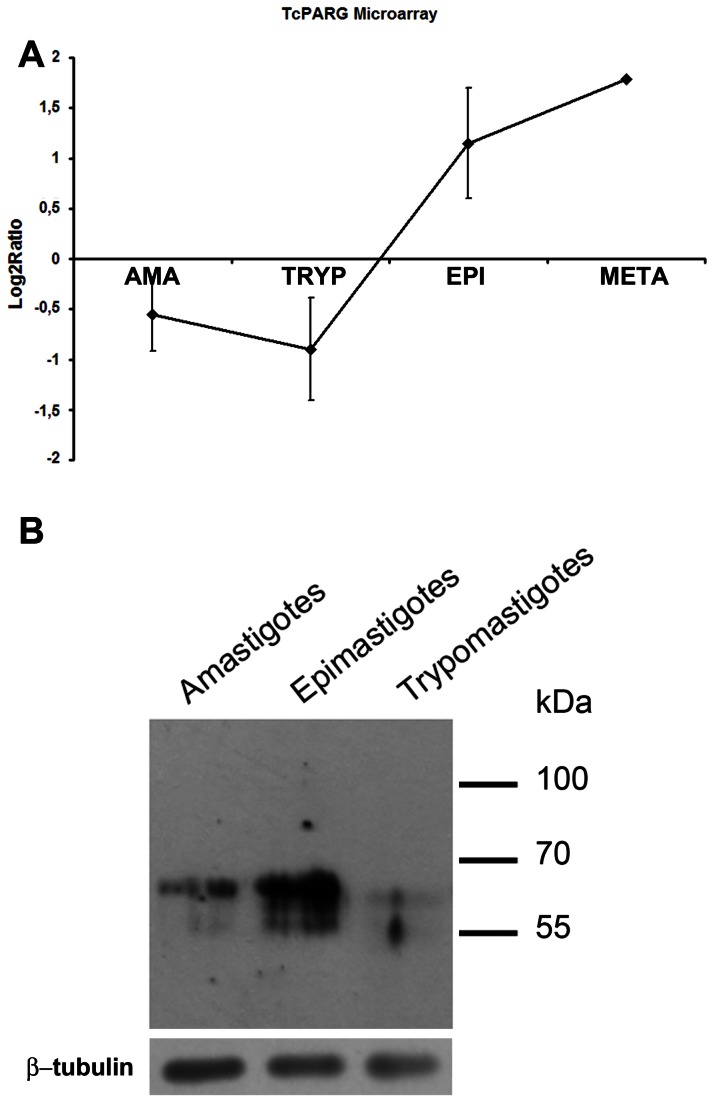
Figure 2. Expression of TcPARG throughout the Trypanosoma cruzi life-cycle.
(A) Microarray expression data for TcPARG over the course of T. cruzi life-cycle. TcPARG mRNA relative abundance was evaluated by using the transcriptome analysis of different T. cruzi stages available at Gene Expression Omnibus database (www.ncbi.nlm.nih.gov/geo, DataSets: GSE14641). Shown are mean microarray log2 ratios (stage/reference) for TS significantly regulated in Trypanosoma cruzi amastigotes (AMA), trypomastigotes (TRYP), epimastigotes (EPI), and metacyclic trypomastigotes (META). (B) Western blot analysis of the three life-cycle stages of T. cruzi. Protein extracts (35 µg) of amastigote, epimastigote or trypomastigote stages of T. cruzi were solved in a 10% polyacrylamide gel, transfer to a nitrocellulose membrane and revealed with an anti-TcPARG (1:10000) specific antiserum. β-tubulin was used as loading control.

