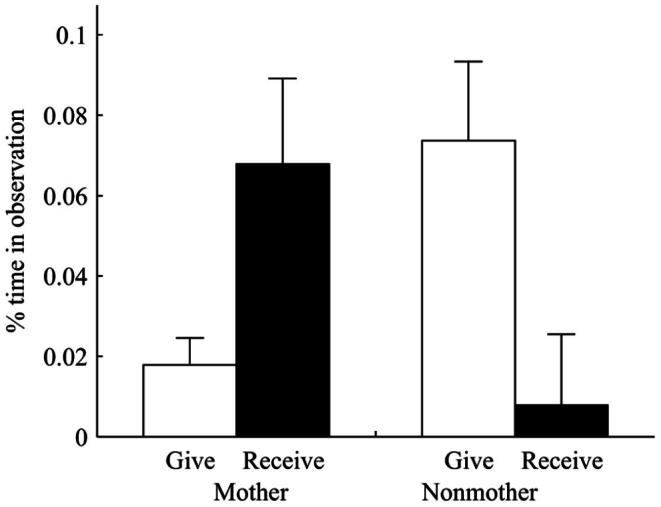
Figure 2. Percentage of time grooming (mean ± SE) mothers gave (▪) and received (□) compared to the grooming nonmothers gave and received.

The proportion of grooming mothers received from nonmothers was significantly higher than the proportion of grooming mothers gave to nonmothers on each day after parturition (paired t test: t 35 = −9.43, p<0.01). Nonmothers gave significantly more grooming to mothers than they received from mothers (paired t test: t 47 = −13.72, p<0.01).
