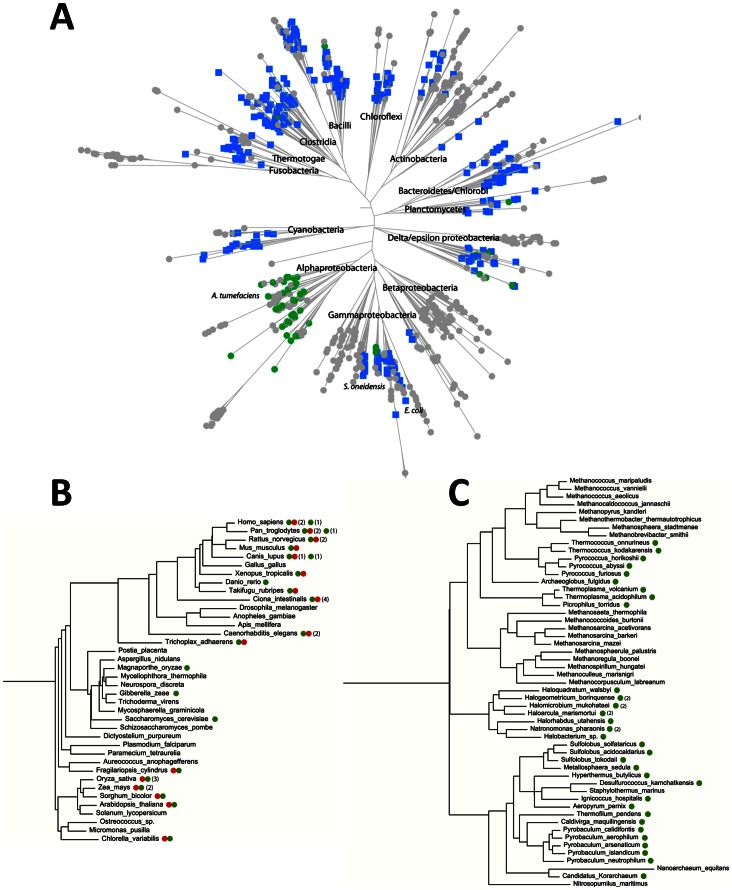
Figure 6. Phylogenetic distribution and domain composition of COG1058.
Schematic representation of bacterial (A), eukaryotic (B) and archaeal (C) species trees showing COG1058 genes mapping. Green circle designates the COG1058 gene; the FAD synthase gene is represented by a red circle; the fused COG1058/pncC gene is shown as a blue square. Numbers within squares represents the number of gene copies per genome.

