
Figure 4. Maximum likelihood tree based on archaeal amoA gene sequences.
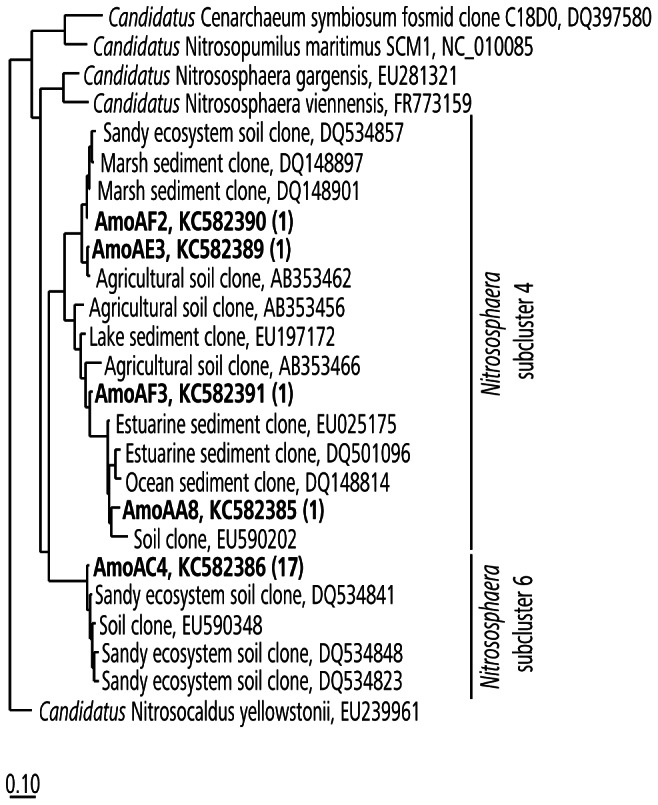
Sequences recovered in this study are shown in bold. Information in parenthesis gives the number of retrieved sequences. Bar refers to 10% nucleotide substitutions per site.
Official websites use .gov
A
.gov website belongs to an official
government organization in the United States.
Secure .gov websites use HTTPS
A lock (
) or https:// means you've safely
connected to the .gov website. Share sensitive
information only on official, secure websites.
Sequences recovered in this study are shown in bold. Information in parenthesis gives the number of retrieved sequences. Bar refers to 10% nucleotide substitutions per site.