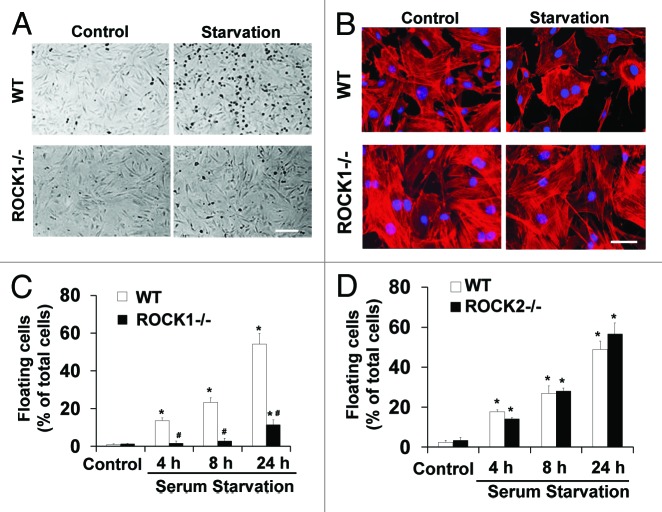
Figure 6. ROCK1 deletion, but not ROCK2 deletion, reduces serum starvation-induced cell detachment. (A) Representative image of bright field photography of WT and ROCK1−/− cells before and after 8 h of serum starvation showing starvation-induced cell detachment. Bar, 400 μm. (B) Representative images of rhodamine-phalloidin staining for F-actin (red) and DAPI staining (blue) of WT and ROCK1−/− cells before and after 8 h of serum starvation showing starvation-induced disruption of central stress fibers and cell shrinkage. Bar, 100 μm. (C andD) Floating and attached cells were separately collected from WT and ROCK1−/− cells or from WT and ROCK2−/− cells at indicated time points after serum starvation. Floating cell ratio was expressed as percentage of total cells (floating plus attached cells) under indicated condition. *p < 0.05 vs. control of the same genotype; #p < 0.05 vs. WT under the same treatment condition.

An official website of the United States government
Here's how you know
Official websites use .gov
A
.gov website belongs to an official
government organization in the United States.
Secure .gov websites use HTTPS
A lock (
) or https:// means you've safely
connected to the .gov website. Share sensitive
information only on official, secure websites.
