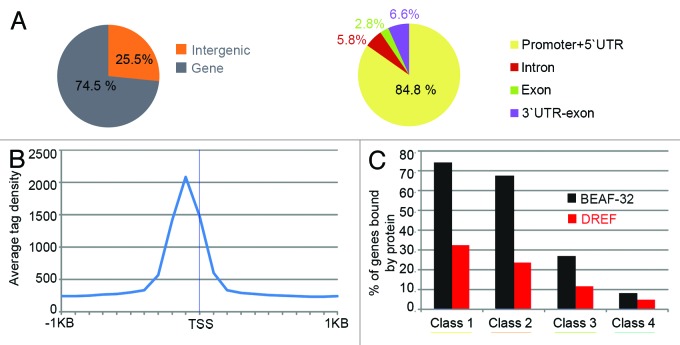
Figure 3. Distribution of DREF binding regions in the genome. (A) Distribution of DREF binding sites with respect to gene features. (B) DREF tag enrichment around transcription start sites (TSSs) of DREF-bound genes. (C) Histogram indicating the fraction of DREF and BEAF-32 bound genes and their gene expression levels in wing imaginal tissue. The percentages refer to the fraction of BEAF-32-bound genes within each class. Class I corresponds to the 25% most highly transcribed genes, whereas class 4 corresponds to the lowest 25%.

An official website of the United States government
Here's how you know
Official websites use .gov
A
.gov website belongs to an official
government organization in the United States.
Secure .gov websites use HTTPS
A lock (
) or https:// means you've safely
connected to the .gov website. Share sensitive
information only on official, secure websites.
