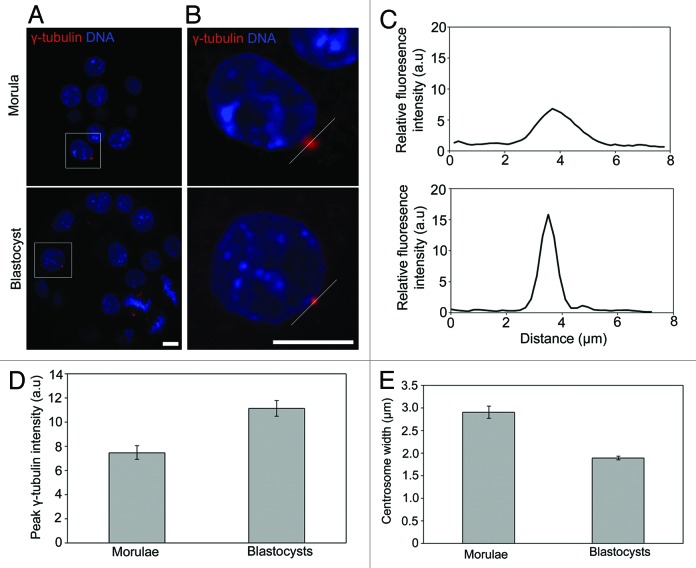
Figure 2. Centrosome focusing concomitant with centriole emergence. (A) Typical confocal sections of γ-tubulin foci in morulae and blastocysts. (B) Zoom of the area highlighted in (A). White lines indicate the linescan plotted in (C). (D) Quantification of peak γ-tubulin intensity and (E) centrosome width in morulae and blastocysts. 50–70 γ-tubulin foci examined from 9–10 embryos per stage. Scale 10 µm.

An official website of the United States government
Here's how you know
Official websites use .gov
A
.gov website belongs to an official
government organization in the United States.
Secure .gov websites use HTTPS
A lock (
) or https:// means you've safely
connected to the .gov website. Share sensitive
information only on official, secure websites.
