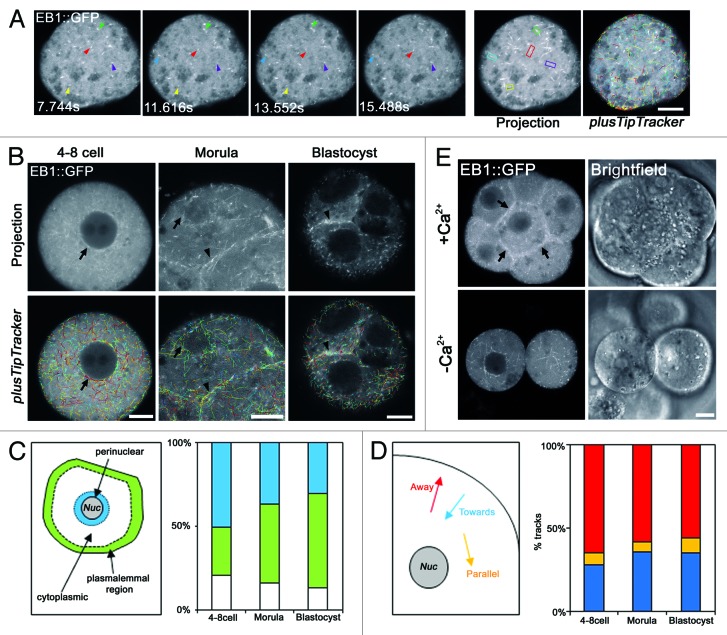
Figure 4. Dynamic tracking of MT growth events in early embryos. (A) Representative confocal time-series of EB1::GFP comets in a 4–8-cell stage blastomere. Each colored arrowhead tracks the movement of a single EB1::GFP comet. A maximum intensity projection of the entire time series is shown (right). Each MT growth event appears as a line of fluorescence. MT growth events identified by plusTipTracker software are shown far right. (B) Typical examples of MT growth events during development. (C) Analysis of relative density of MT growth events corrected for area in perinuclear, plasmalemmal and cytoplasmic regions. 1016–8309 tracks from 5–12 movies examined per developmental stage. (D) Analysis of cytoplasmic MT growth directionality in developing embryos. 49–125 tracks from 5–11 movies. Tracks were considered parallel to the nucleus within a ~10° range of the nuclear tangent. (E) Projections of morula-stage embryos experimentally de-compacted by removal of extracellular Ca2+. Note loss of cell-cell adhesion reduces EB1::GFP track abundance at cell-cell interfaces (arrows; n = 20). Scale 10 µm.

An official website of the United States government
Here's how you know
Official websites use .gov
A
.gov website belongs to an official
government organization in the United States.
Secure .gov websites use HTTPS
A lock (
) or https:// means you've safely
connected to the .gov website. Share sensitive
information only on official, secure websites.
