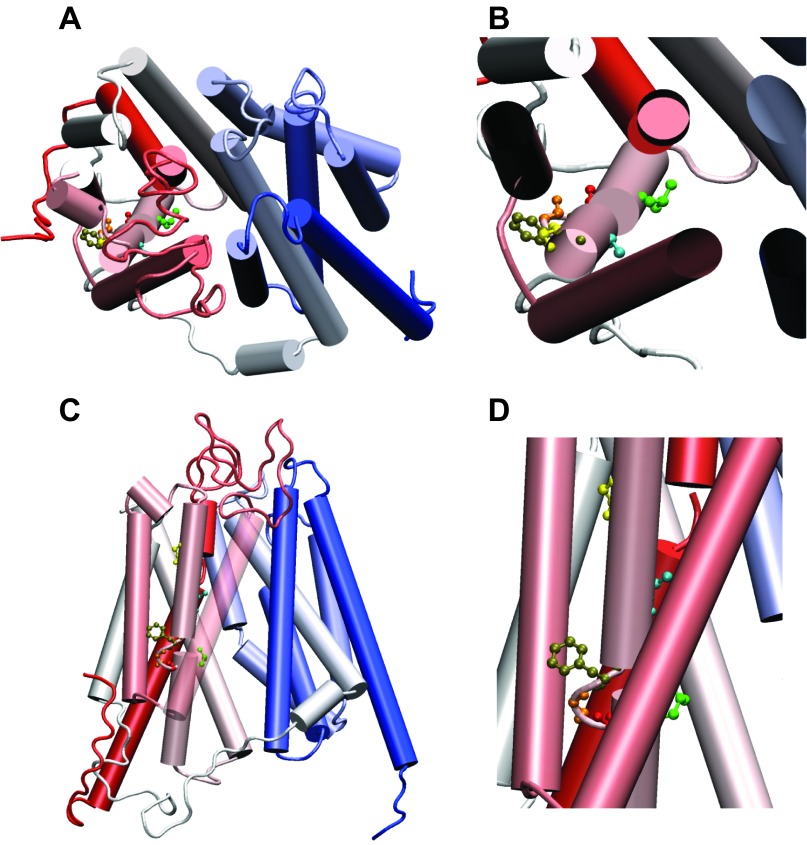
Fig. 6.
A homology model representation of PCFT. Helices are shown in cylinders and colored from the NH2 to the COOH terminal using a red-to-blue color transition. Cys mutated residues are shown in ball-and-stick representation: Gly147 in yellow, Ala152 in blue, Phe157 in tan, Gly158 in orange, Gly159 in red, Leu161 in green. A and B: top views of PCFT looking in from the extracellular space. B: enlarged view of a segment of A. C: side view of PCFT, as it is embedded in the membrane bilayer. The second transmembrane domain is translucent to enhance visibility of this region. D: enlarged view of C.

