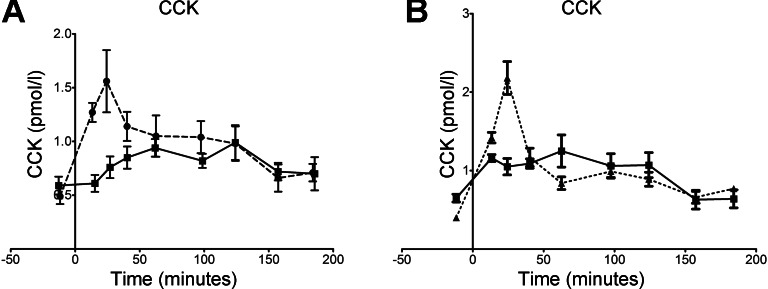
Fig. 2.
A: blood plasma concentrations of CCK measured before and after consumption of the control (broken line) and active (solid line) meals. B: two groups of controls: those showing a significant increase in CCK at 30 min (n = 5; broken line) and those that did not (n = 4; solid line). Mean and SE values are shown in both graphs.

