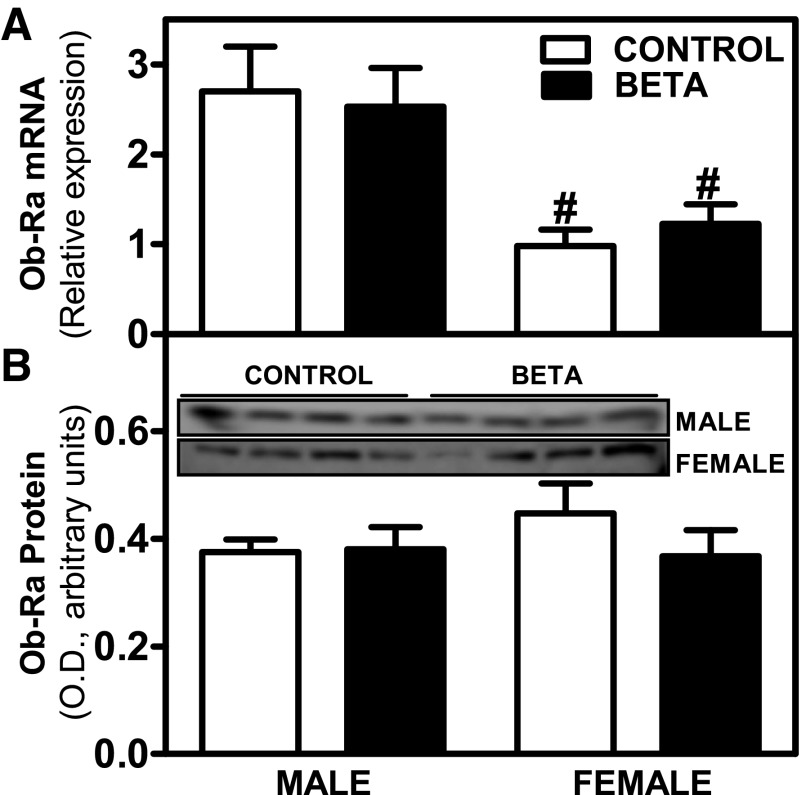
Fig. 2.
Expression levels of leptin receptor isoform Ob-Ra. Effects of antenatal Beta on mRNA [GC-treated (beta; ■), male and (n = 8) female = (n = 10); control (□), male (n = 6) and female (n = 6)] (A) and protein expression [GC-treated (Beta), male (n = 5) and female (n = 5); control, male (n = 5) and female (n = 5)] (B) of leptin receptor isoform Ob-Ra. Each no. indicates no. of animals analyzed. Data are expressed as means ± SE. #P < 0.05 vs. male. B, top, shows Western blot data. OD, optical density.

