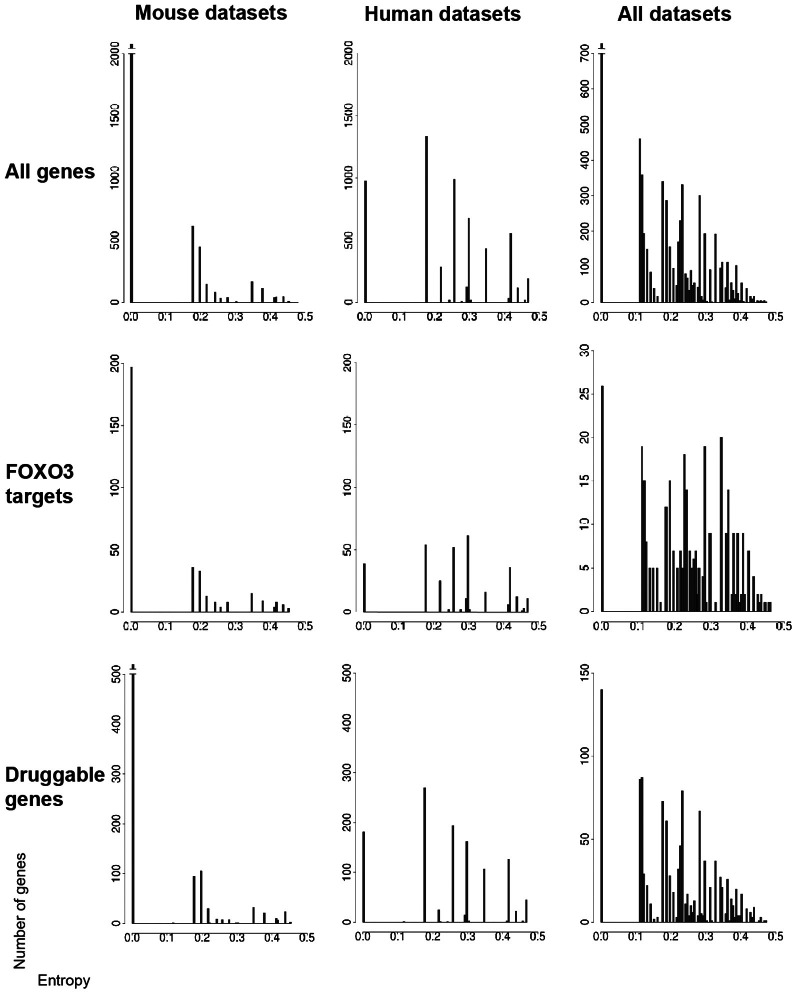
Figure 2.
Gene entropy values across murine and human datasets. Datasets (seven conditions in the mouse and seven conditions in humans) are listed in the main text. Gene entropy values are shown for three categories of genes (all genes, FOXO3 targets only, druggable genes only) and for genes which are (1) retained by intersecting transcriptomic and gene-interaction data and (2) further instructed by at least six conditions in the mouse, six conditions in humans and 11 conditions in both species. The maximally achievable entropy value in these analyzes is 0.5. The corresponding gene lists are shown in Tables S3–5 as organized by species or across species and as shown for all numbers of instructive conditions.

