
Figure 3.
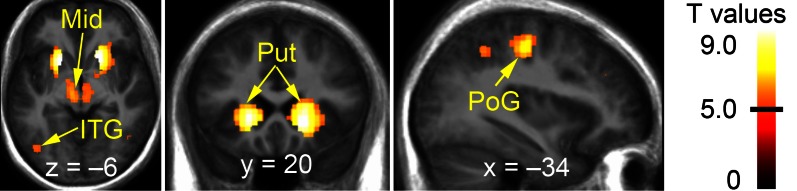
Brain regions showing significantly stronger effects during vicarious than active playing (during win or loss gameplay events). The data have been thresholded at P < 0.05 (FWE-corrected; min. cluster size 50 voxels). Black horizontal line on the colorbar (on the right) illustrates the lowest significant T-value. Mid, midbrain; ITG, inferior temporal gyrus; Put, putamen; PoG, post-central gyrus.