
Fig. 6.
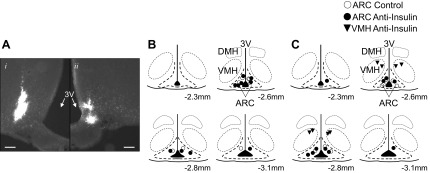
A: photomicrograph of a bilateral ARC injection site with left (i) and right (ii) sides. In this animal, the injection sites were 120 μm apart in the rostral-caudal plane. Scale bars = 100 μm. B and C: schematic illustration of ARC or VMH injection sites for animals injected with intracerebroventricular insulin (B) or that received a hyperinsulinemic-euglycemic clamp (C).