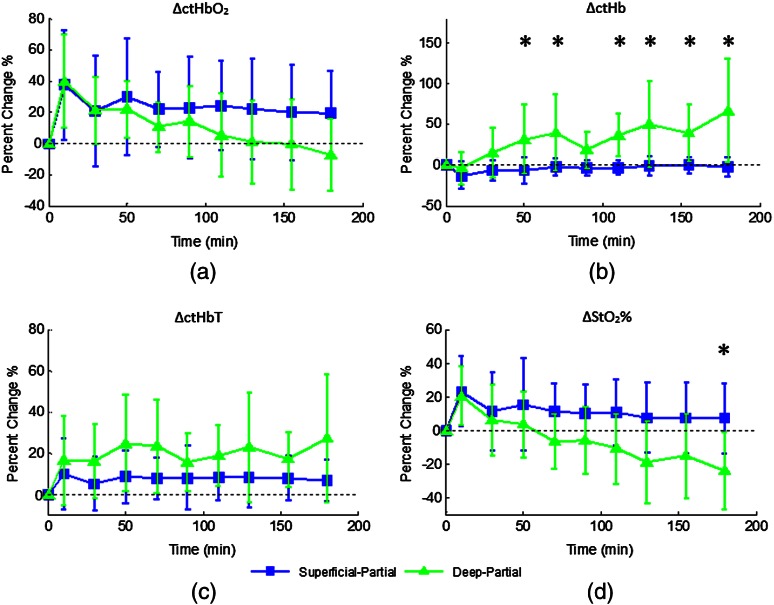
Fig. 4.
Percent changes of (a) oxygenated hemoglobin concentration, (b) deoxygenated hemoglobin concentration, (c) total hemoglobin concentration, and (d) oxygen saturation over the 3-h imaging period for both partial thickness burn populations. Regions of interests were selected directly over burn wounds. Time points with significant differences are marked with an asterisk.

