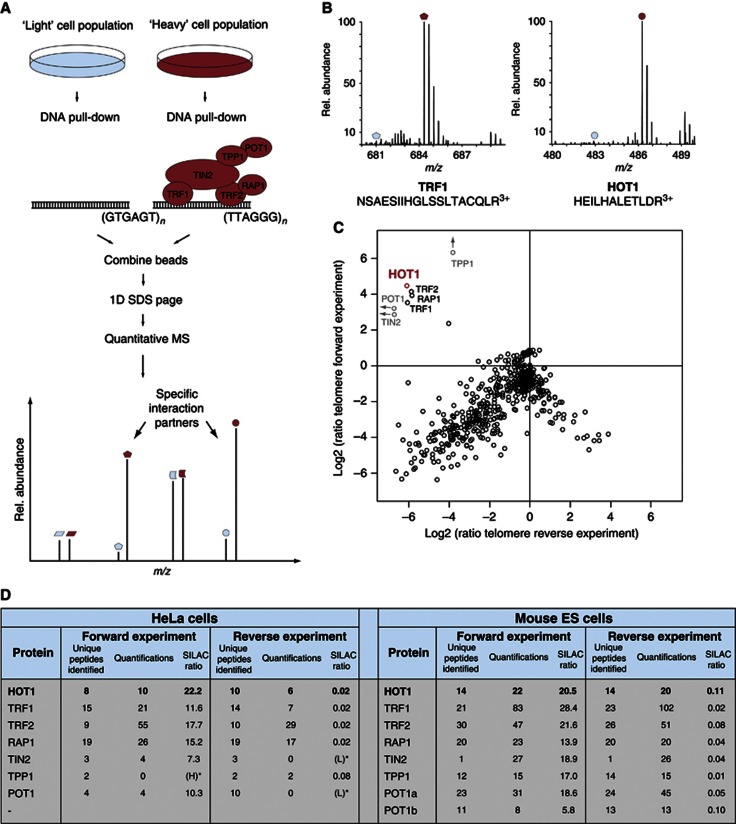
Figure 1.
Detection of specific telomere-interacting proteins. (A) A schematic of the quantitative SILAC-based DNA interaction screen with DNA oligonucleotides containing either the telomeric repeat or a control sequence. Specific interaction partners are differentiated from background binders by a SILAC ratio other than 1:1. (B) MS spectra of representative peptides from the ‘forward’ pull-down experiment. The heavy peptide partners are easily detected (red dots), while the light partner is barely observable (blue dots) in the mass spectrum. (C) Two-dimensional interaction plot: known shelterin components cluster together with HOT1, demonstrating enrichment at the telomere sequence compared to the control sequence. (D) Summary of the MS data for HOT1 and the core shelterin components from the SILAC-based DNA–protein interaction screens carried out with nuclear extracts derived from HeLa and murine ES cells.

