Figure 4.
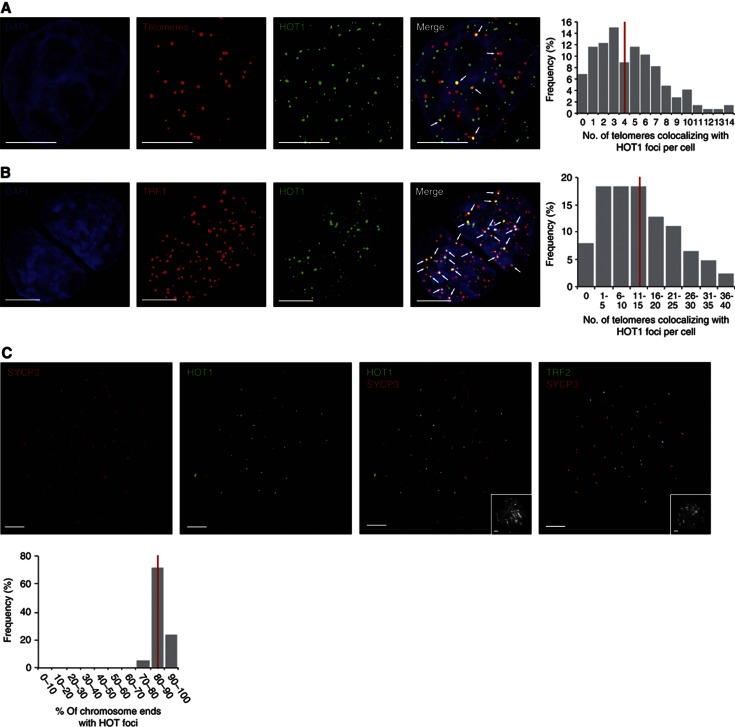
The degree of HOT1–telomere association varies between cell types. (A) Colocalization analysis of telomeres and HOT1 in HeLa cells by immunoFISH staining. A representative image illustrating the colocalization between several HOT1 foci (green) and telomeres (red) is shown. DAPI (blue) is used as nuclear counterstain. Colocalization events are indicated by arrows. Scale bars represent 5 μm. The quantification of the frequency of colocalization events was done after a 3D reconstruction of the acquired Z-stacks (n=147). The average value is indicated by a red bar. (B) Colocalization analysis of TRF1 and HOT1 in mouse ES cells by IF staining. To visualize TRF1 a LAP cell line (Poser et al, 2008) was used, expressing GFP-tagged TRF1 at endogenous expression levels. A representative image illustrating the colocalization between several HOT1 foci (green) and TRF1 (red) is shown. DAPI (blue) is used as a nuclear counterstain. Colocalization events are indicated by arrows. Scale bars represent 5 μm. The quantification of the frequency of colocalization events was done after a 3D reconstruction of the acquired Z-stacks (n=126). The average value is indicated by a red bar. (C) IF stainings of HOT1 at chromosome ends of mouse pachytene chromosome spreads. Representative images illustrating the localization of HOT1 and TRF2 (in green) to chromosome ends are shown. The synaptonemal complex/chromosome axis is marked by SYCP3 (red). The same field of view for the DNA counterstained by DAPI (greyscale) is shown in the bottom right corners. Scale bars represent 5 μm. The quantification of HOT1 foci at chromosome ends was done after a 3D reconstruction of the acquired Z-stacks (n=21). The average value is indicated by a red bar.

