Figure 5.
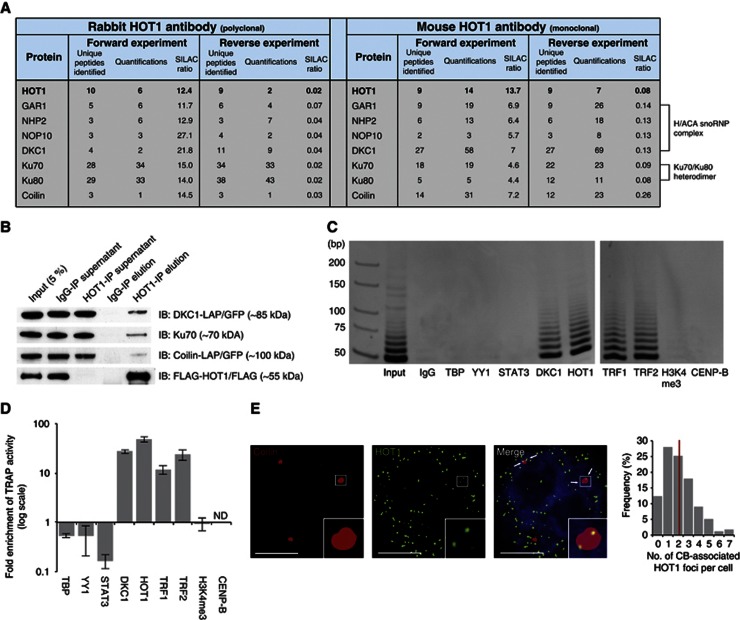
HOT1 associates with telomerase and CB complex components. (A) Summary of SILAC-based protein–protein interactions. Identification and normalized SILAC ratios are indicated for HOT1 (bait) and the identified interaction partner relevant for telomere biology from immunoprecipitation using both a rabbit and a mouse anti-HOT1 antibody. (B) Validation of the MS identifications by conventional immunoprecipitation. Nuclear HeLa extracts were subject to immunoprecipitation with either a polyclonal rabbit anti-HOT1 or an IgG antibody, and were immunoblotted for DKC1, Ku70 and Coilin. HOT1 IPs for the coprecipitation of DKC1 and Coilin were carried out in corresponding LAP cell lines (Poser et al, 2008) and both proteins were detected with anti-GFP antibody. FLAG–HOT1 was used to monitor the efficiency of the IP and a representative blot is shown. (C) Visualization of telomerase activity enrichment by gel electrophoresis in immunoprecipitations using antibodies against HOT1, DKC1 (positive control), TBP, YY1, STAT3, H3K4me3 and CENP-B (negative controls), as well as TRF1 and TRF2, using extracts from HeLa cells. All antibodies are rabbit polyclonal. A representative gel image of quantitative TRAP reaction products is shown. Samples were loaded on two gels and run in parallel represented by a gap between gel pictures. (D) Quantification of telomerase activity enrichment from the immunoprecipitations in panel C. Enrichments are normalized to immunoprecipitations using an IgG control. Error bars represent the s.d. of three independent experiments. Enrichments for DKC1, HOT1, TRF1 and TRF2 are statistically significant with P<0.05 (Student’s t-test). (E) Colocalization analysis of Coilin and HOT1 in HeLa cells by immunofluorescence staining. A representative image illustrating the colocalization between several HOT1 foci (green) and CBs (red; staining for Coilin) is shown. DAPI (blue) is used as nuclear counterstain. Colocalization events are indicated by arrows. An enhanced magnification of the boxed area is shown in the bottom right corners. Scale bars represent 5 μm. The quantification of the frequency of colocalization events was done after a 3D reconstruction of the acquired Z-stacks (n=179). The average value is indicated by a red bar.
Source data for this figure is available on the online supplementary information page.

