Figure 4.
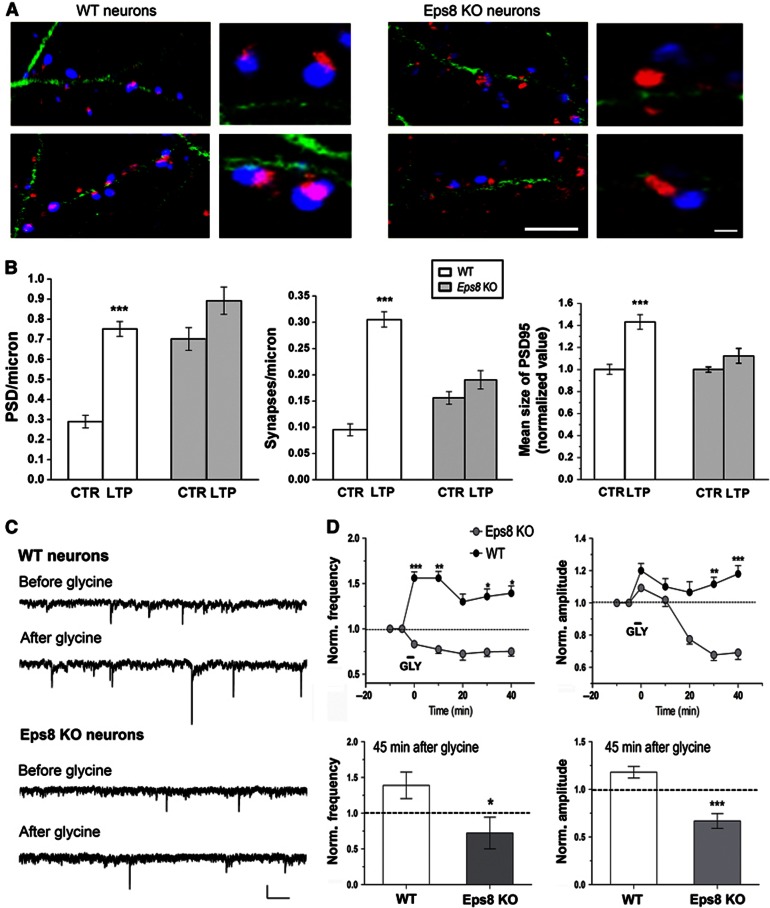
Lack of Eps8 impairs long-term potentiation. (A) Representative images of wt and KO cultured neurons before and after application of chemical LTP. Neurons are stained for tubulin (green), PSD-95 (red) and v-Glut1 (blue). Scale bars 10 and 2 μm for higher-magnification images. (B) Quantification of potentiation, as represented by number per unit length of PSD-95 (left), synapse density (middle), mean size of PSD-95 (right). Potentiation occurs in wt but not Eps8 KO cultures (Mann–Whitney rank sum test, P<0.001). Data are expressed as mean±s.e.m.; normalized values (total number of examined neurons for analysis of PSD-95 or synapse density: 35 wt ctr and 36 wt LTP; 33 KO ctr and 75 KO LTP; total number of fields for analysis of PSD-95: 46 wt ctr and 59 wt LTP; 72 KO ctr and 90 KO LTP; size number of independent experiments 5). (C, D) Electrophysiological analysis of LTP. (C) Representative mEPSCs traces before and after the induction of chemical LTP, in wt and KO neurons. (D) Analysis of mEPSC frequency and amplitude at different recording times (5 min before LTP application, 5, 10, 20, 30 and 40 min after LTP application) shows that KO neurons are unable to undergo LTP. Graphs indicate the mEPSC mean frequency and amplitude 45 min after the application of LTP. Scale bars, 10 pA and 250 ms (total number of examined neurons: 13 wt and 16 KO; number of independent experiments: 5).

