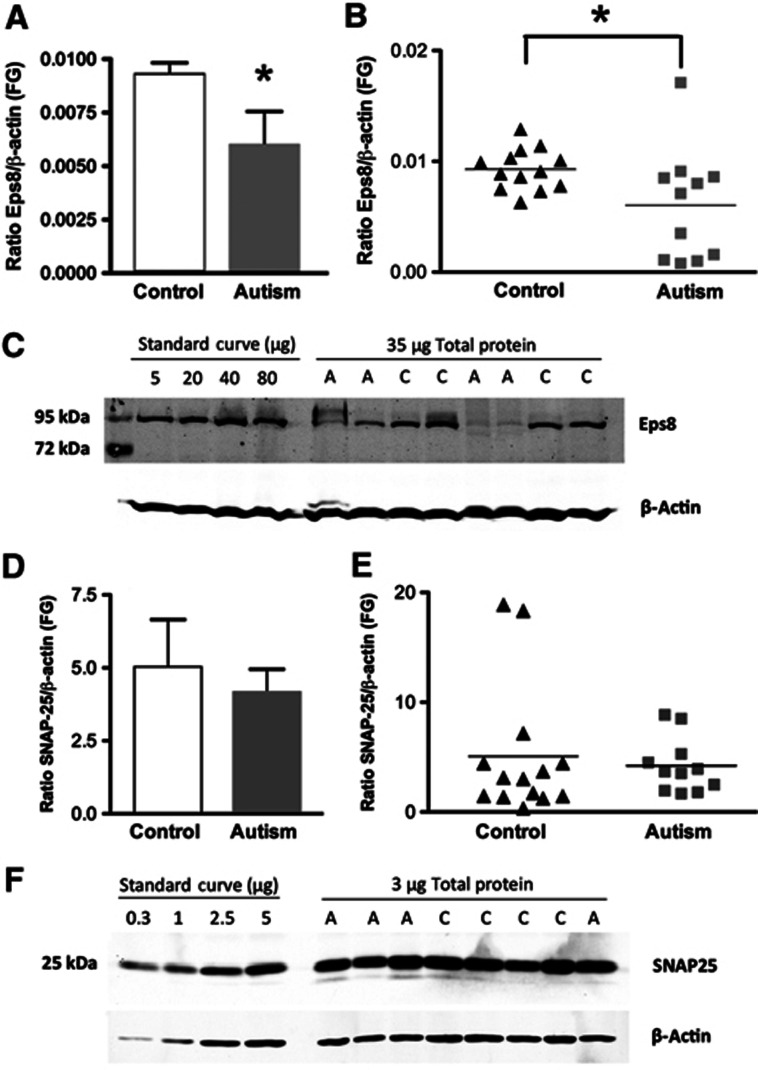
Figure 6.
Eps8 expression levels are reduced in brains of patients affected by Autism. (A, B) Quantification of Eps8 protein expression in fusiform gyrus (FG) of autism and control samples by Western blotting. Each sample was normalized to β-actin. *P<0.05, two-tailed Student’s t-test. Bars indicate mean±s.e. Autism, n=11; control, n=13. (C) Representative western blot of fusiform gyrus showing autism (A) and control (C) cases. Lanes 2–5: standard curve consisting of different amounts of total protein from a single normal human cortex sample. Lanes 6–13: 35 μg of total protein from each autism and control sample. Blots were run twice with two different Eps8 antibodies and gave similar results. (D, E) No change in SNAP-25 levels in fusiform gyrus of autism subjects compared to controls. Quantification of SNAP-25 protein expression in fusiform gyrus (FG) of autism and control samples determined by western blotting. Each sample was normalized to β-actin. P=0.67, two-tailed t-test. Bars indicate mean±s.e. Autism, n=11; control, n=13. (F) Representative western blot of fusiform gyrus showing autism (A) and control (C) cases. Lanes 1–4: standard curve consisting of different amounts of total protein from a single normal human cortex sample. Lanes 5–12: 3 μg of total protein from each autism and control sample.

