Figure 7.
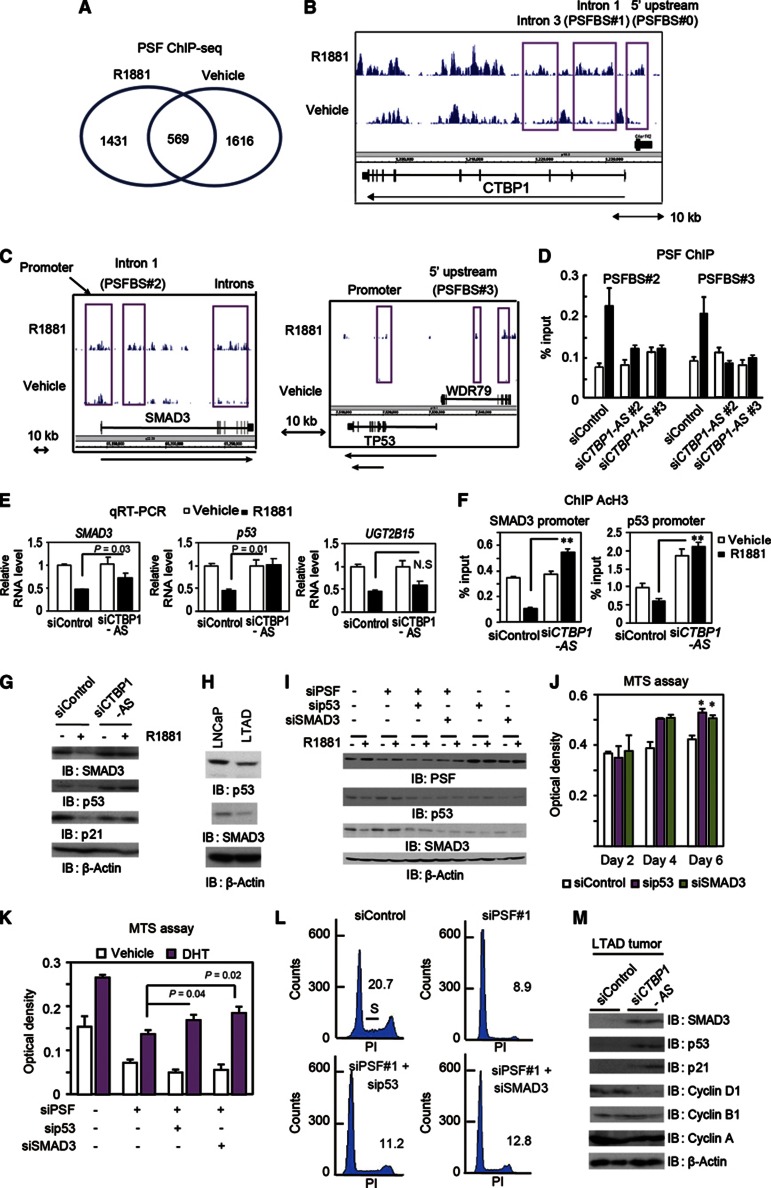
Cooperative trans-regulatory function of CTBP1-AS and PSF in inhibiting cell cycle regulators. (A) Identification of PSF binding by ChIP-sequence. LNCaP cells were treated with 10 nM R1881 or vehicle for 24 h. Analysis of PSF-binding sites (PSFBSs, >5-fold) was performed by ChIP-sequence. (B) Androgen-dependent PSFBSs at 5′ upstream region (PSFBS#0), intron 1 (PSFBS#1), and intron 3 are indicated in CTBP1 locus. (C) Analysis of PSF binding in the vicinity of the SMAD3 and p53 loci. PSFBSs in the promoter and intron 1 (PSFBS#2) of SMAD3 (left) and PSFBSs in the promoter and 5′ upstream region (PSFBS#3) of p53 (right) are indicated. Two transcriptional variants of p53 are indicated by arrows. (D) PSF binding was dependent on CTBP1-AS induction. LNCaP cells were transfected with siControl, siCTBP1-AS#2, or siCTBP1-AS#3 (10 nM). PSF ChIP analysis was performed after 24 h treatment with 1 nM R1881 or vehicle. (E) qRT–PCR analysis (n=3) of SMAD3, p53, and UGT2B15 after siCTBP1-AS treatment. LNCaP cells were treated with 10 nM R1881 or vehicle for 24 h and then qRT–PCR was performed. NS, P>0.05. (F) Histone deacetylation of SMAD3 and p53 promoters was reversed by siCTBP1-AS. ChIP-analysis (n=3) of AcH3 in the promoters of p53 and SMAD3. **P<0.01. (G) Immunoblots for p53, SMAD3, and p21 in LNCaP cells transfected with siRNAs after 48-h ligand treatment. (H) Reduced expression of p53 and SMAD3 in LTAD cells. (I) Knockdown of p53 and SMAD3 in LNcaP cells. (J) SMAD3 and p53 knockdowns promote prostate cancer cell proliferation. MTS assay of LNCaP cells transfected with siControl, sip53, and siSMAD3 (n=4). *P<0.01. (K) MTS assay of LNCaP cells transfected with siControl, siPSF#1, siPSF#1+sip53, and siPSF#1+siSMAD3 (n=4). The assay was performed on day 3 after ligand treatment. (L) siPSF-mediated cell cycle repression is partially reversed by p53 and SMAD3 knockdown. Cell cycle analysis of LNCaP cells transfected with siControl, siPSF#1, siPSF#1+sip53, and siPSF#1+siSMAD3. Percentages of cells in the S phase are indicated. (M) Immunoblots for p53, SMAD3, p21, and cyclins in the LTAD tumour lysates shown in Figure 4I. Bar: s.d.
Source data for this figure is available on the online supplementary information page.

