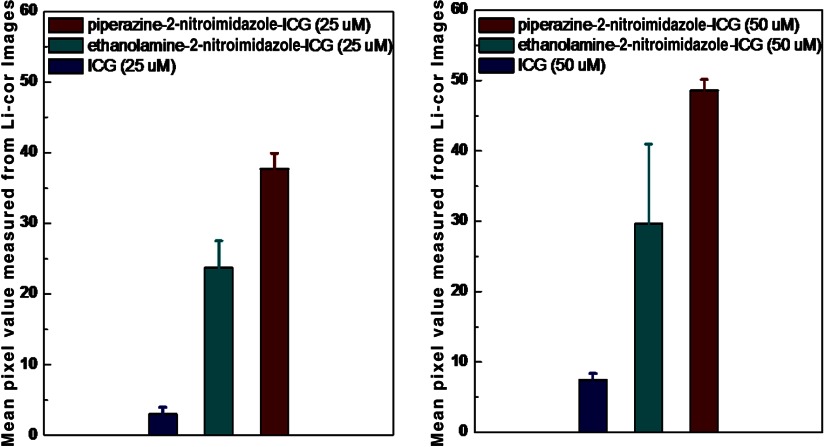
Fig. 11.
(a) The mean fluorescence signals and standard deviations of the three sets of mice injected with ICG, ethanolamine-2-nitroimidazole-ICG, and piperazine-2-nitroimidazole-ICG in 25 μM concentrations. The mean signal strengths were 3.0 (), 21.7 (), and 37.7 (), respectively. (b) The mean fluorescence signals and standard deviations of the three sets of mice injected with ICG, ethanolamine-2-nitroimidazole-ICG, and piperazine-2-nitroimidazole-ICG in 50 μM concentration. The mean fluorescence signals were 7.45 (), 29.6 (), and 48.6 (), respectively.

