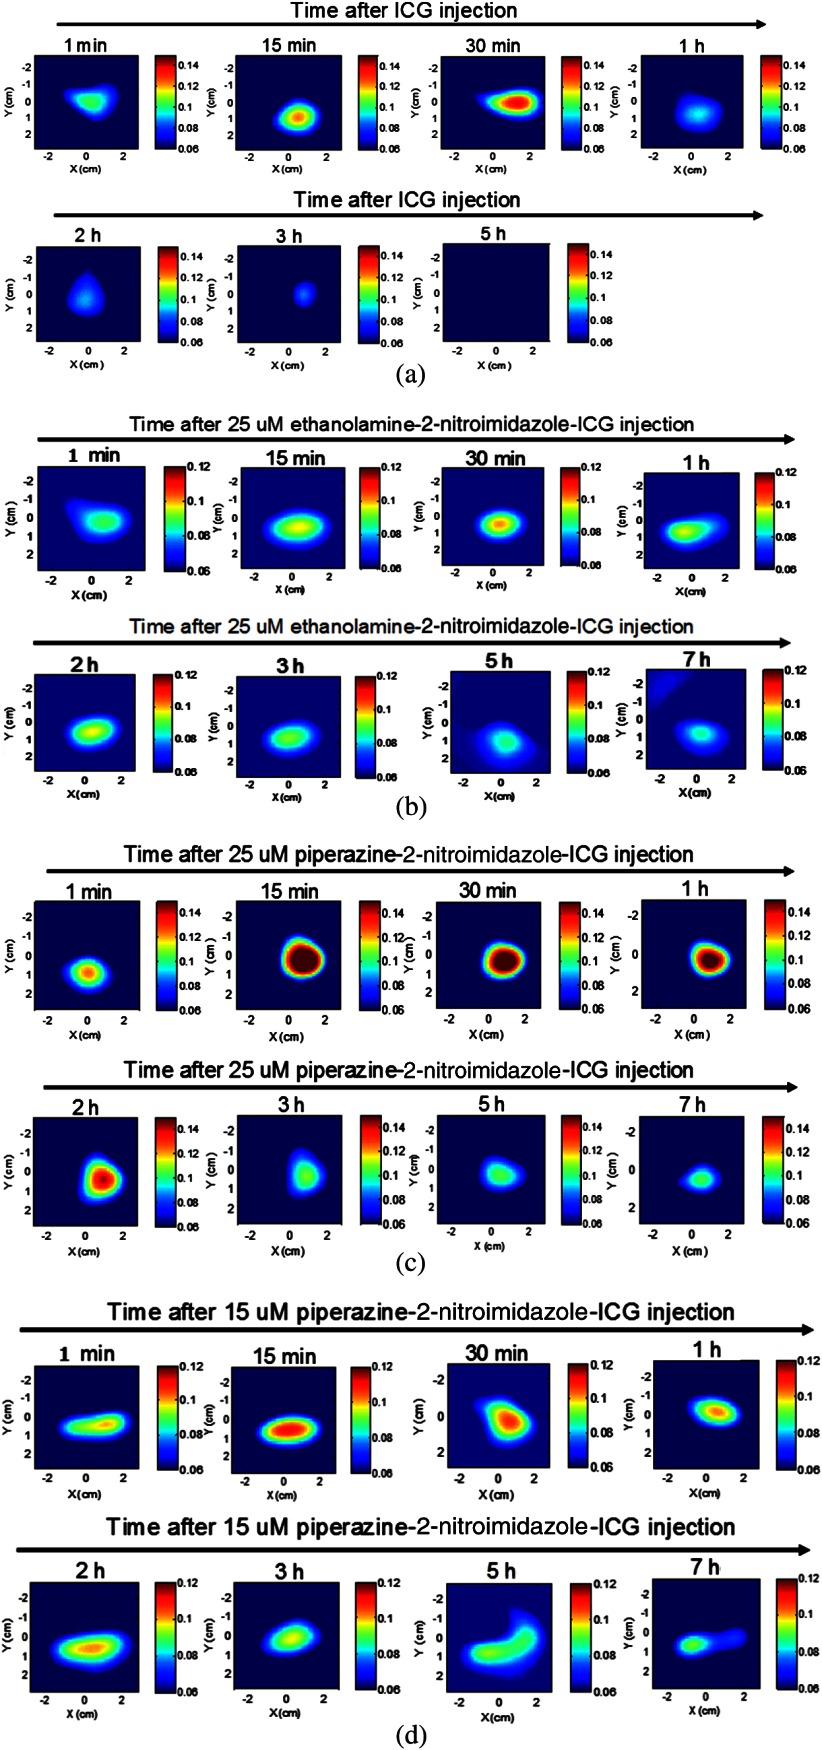
Fig. 5.
Fluorescence tomography images of four mice obtained over 5 to 7 h. (a) Images of mouse with tumor size of 10 mm injected with ICG and monitored over 5 h. (b) Images of mouse with tumor size of 8 mm injected with 25 μM ethanolamine-2-nitroimidazole-ICG and monitored for 7 h. (c) Images of mouse with tumor size of 8 mm injected with 25 μM piperazine-2-nitroimidazole-ICG and monitored for 7 h. (d) Images of mouse with tumor size of 8 mm injected with 15 μM piperazine-2-nitroimidazole-ICG and monitored for 7 h. The time points are marked on images. The background value is 0.06 μM in all images.

