Fig. 6.
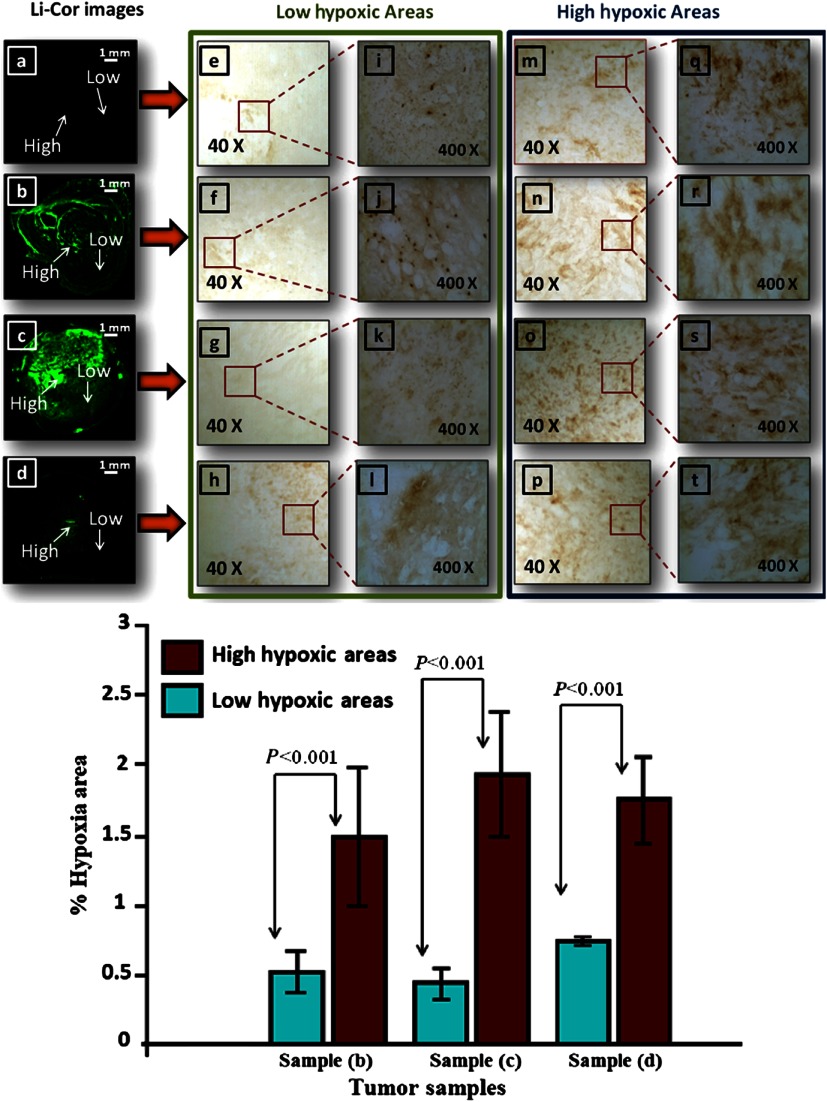
Top: The corresponding ex vivo fluorescence images acquired from the Odyssey Imaging system of (a) mouse image injected with 25 μM ICG, (b) mouse image injected with 25 μM ethanolamine-2-nitroimidazole-ICG, (c) and (d) corresponding images of two mice injected with 25 and 15 μM piperazine-2-nitroimidazole-ICG, respectively, (e) through (h) corresponding IHC stains (, brown) at low tumor hypoxic area as marked at corresponding images, (m) through (p) corresponding IHC stains () at higher hypoxic area, (i) through (l) corresponding IHC stains at low hypoxic area (, brown), and (q) through (t) corresponding stains at higher hypoxic area. Scale bar is 1 mm in images. Bottom: Percentage of hypoxic area from low fluorescence intensity area (green) and higher intensity area (red) of samples (b) through (d).

