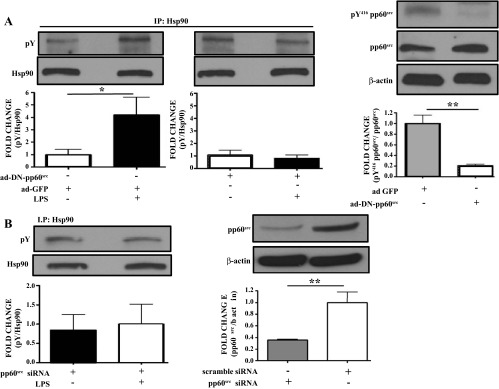
Fig. 5.

pp60src inhibition suppresses the LPS-induced Y phosphorylation of Hsp90. A: Western blot analysis of pY Hsp90 levels in HLMVEC transduced with ad-DN-pp60src or ad-GFP and exposed to LPS or vehicle. Western blotting was performed on samples immunoprecipitated with antibodies against Hsp90. Band density of pY and Hsp90 was analyzed by densitometry and normalized to Hsp90. *P < 0.05 vs. ad-GFP (left). Western blot analysis of pY416 pp60src and pp60src expression in HLMVEC transduced with ad-DN-pp60src or ad-GFP. Band density of pY416 pp60src was analyzed by densitometry and normalized to pp60src expression. β-Actin was used as an additional loading control. **P < 0.01 vs. ad-GFP (right). In all cases, each blot shown represents 1 of 3 independent experiments. Bars represent SE. B: Western blot analysis of pY Hsp90 levels in HLMVEC transduced with pp60src siRNA and exposed to LPS or vehicle. Band density of pY and Hsp90 was analyzed by densitometry and normalized to Hsp90 (left). Western blot analysis of pp60src expression in HLMVEC transfected with either pp60src siRNA or scrambled siRNA. Band density of pp60src was analyzed by densitometry and normalized to β-actin (right). **P < 0.01. In each case, the blot shown represents 1 of 3 independent experiments. Bars represent SE.
