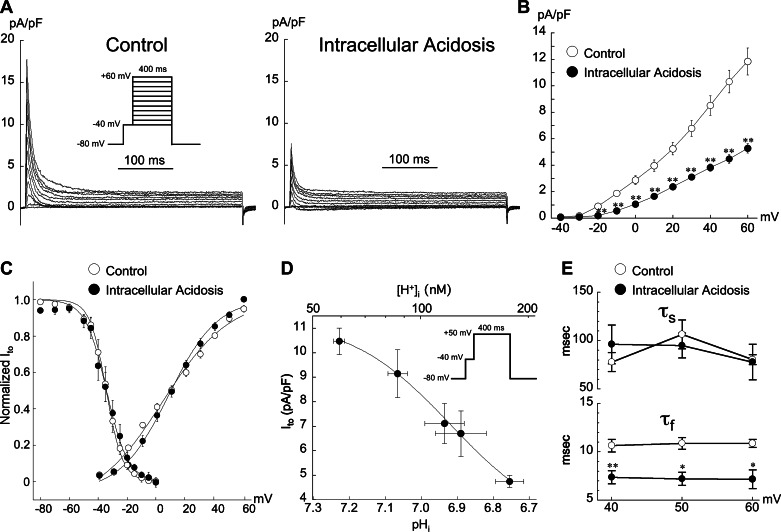
Fig. 6.
Effect of intracellular acidosis on Ito activation in Epi myocytes. A: example records from same cell showing the inhibitory action of intracellular acidosis (80.0 mM acetate) on Ito. Inset: voltage-clamp protocol. B: summary of results illustrating depressed current-voltage (I-V) curve at nearly all voltages (n = 9; **P < 0.01 paired, control vs. acidosis). C: intracellular acidosis (80.0 mM acetate) had negligible effects on steady-state activation and inactivation of Ito. Inactivation results same as shown in Fig. 3B (with Cd2+). Smooth lines are best fits with Boltzmann functions (see materials and methods). D: quantitative relationship between Ito and pHi in Epi myocytes. Data fit with the equation Ito = a + b/{1+[10(pK−pH)]n} (40). The respective values for a, b, pK, and n were 2.81, 8.523, 6.92, and 3.12. Inset: clamp protocol. pHi measurements were done in separate cells, with N values ranging from 5 to 13 and are from Saegusa et al. (41). The magnitude of intracellular acidosis (pHo 7.4) was varied by applying different concentrations of sodium acetate for 2 min while keeping extracellular Ca2+ activity constant. The lowest value of pHi was induced with 80.0 mM acetate. E: effect of low pHi (80.0 mM acetate) on the voltage dependence of Ito inactivation kinetics. Cells were voltage clamped according to the protocol shown in A. Low pHi decreased fast time constant of Ito inactivation (τf) at all voltages (n = 5; **P < 0.01 paired, *P < 0.05, paired, control vs. acidosis). τs, slow time constant of Ito inactivation. For all results shown in this figure pacing CL = 5 s; Cd2+ (200 μM) and normal sodium were present in all bathing solutions.

