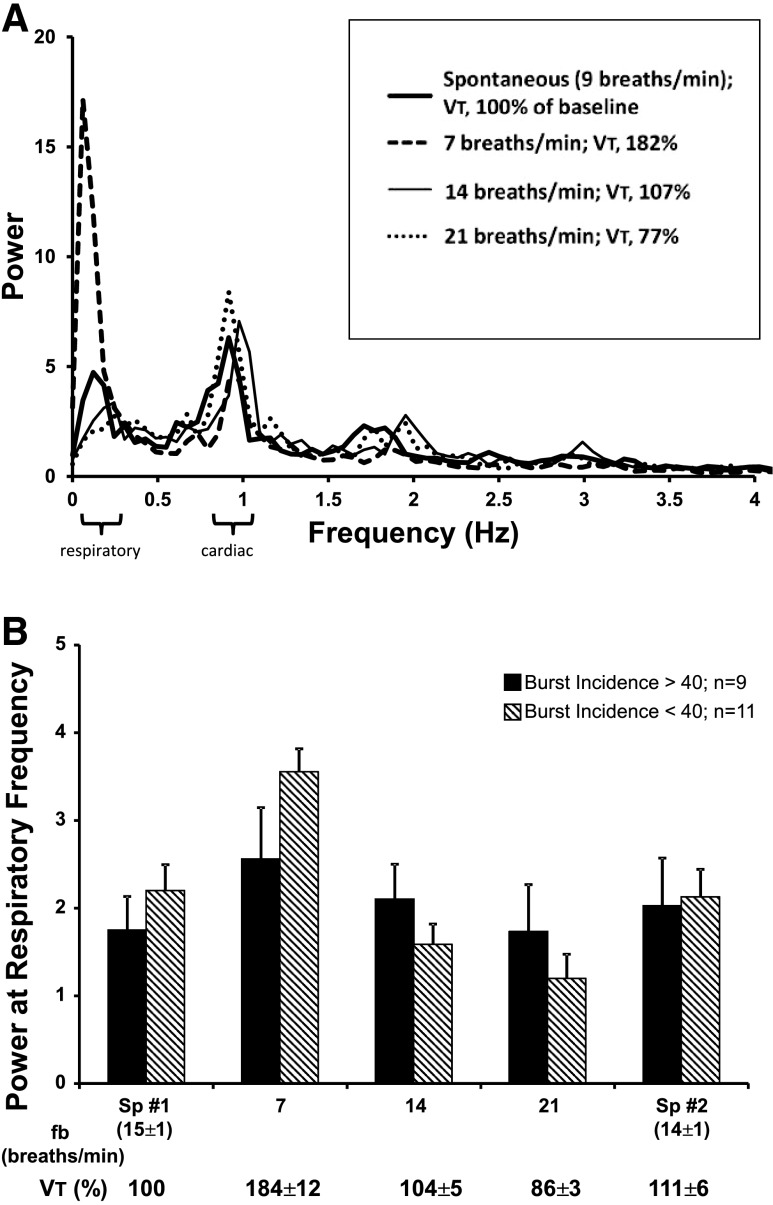
Fig. 2.
A: MSNA power spectra during spontaneous breathing and voluntary decreases and increases in fB with reciprocal changes in VT in one subject. Note that power at the respiratory frequency was greatly increased by slowing fB to 7 breaths/min and diminished by increasing fB to 21 breaths/min. B: mean values for power at the respiratory frequency in subjects divided into two groups: those with relatively high baseline MSNA (burst incidence >40%; filled bars) vs. those with relatively low baseline MSNA (burst incidence <40%; hatched bars). Two-way repeated-measures ANOVA revealed a significant main effect of frequency (P < 0.001) and a significant frequency-by-group interaction (P = 0.027). Sp1, initial spontaneous breathing period; Sp2, final spontaneous breathing period.

