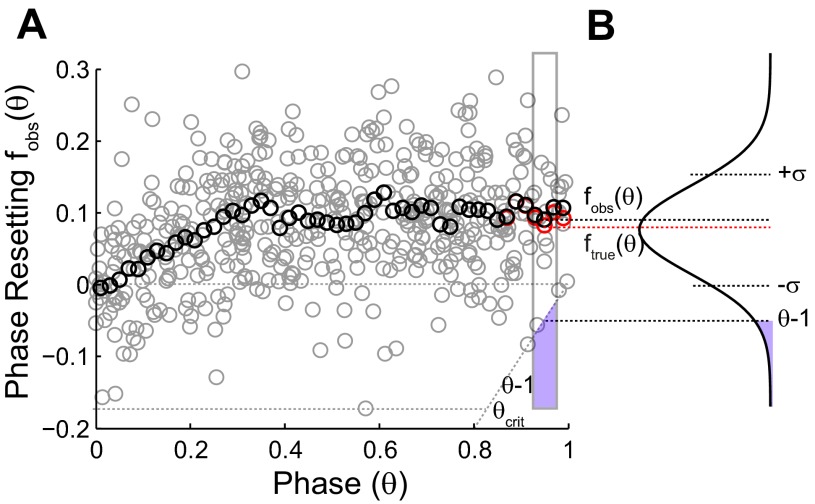
Fig. 3.
Correcting PRCs in response to inhibition for statistical bias. A: the raw phase-resetting data (gray circles) are smoothed (black circles) and corrected for bias (red circles). An example calculation is shown for the rectangular bin outlined in gray. The mean (black circle) at the center of the bin does not represent the true mean or peak of the distribution shown in B because of the purple region truncated by the causal-limit line, whereas the true mean (red circle) does. The SD σ was estimated from the values to the left of θcrit. fobs(θ), observed mean of phase resetting; ftrue(θ), true mean of phase resetting.

