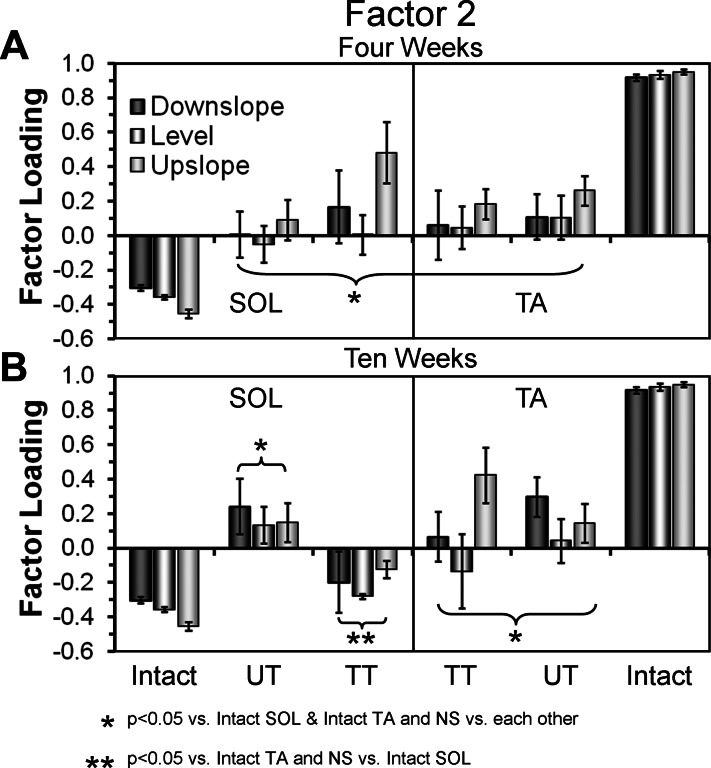
Fig. 7.
Results of factor analysis using principal components (PCA) applied to locomotor EMG activity in the SOL and TA muscles. Activity during multiple individual step cycles was averaged for both muscles during level, upslope, and downslope walking at 11 m/min. Mean values (+SE) of factor loadings for factor 2, which accounts for 20% of the variance in the data set, are shown from activity recorded at 4 wk (A) and 10 wk (B) after sciatic nerve transection and repair. Bars representing data from downslope, level, and upslope treadmill locomotion are shown in different shadings. Data from the SOL muscle are shown to the left of each panel. Similar findings from the TA muscle are shown to the right in each panel. Data from Intact, Untreated (UT), and TT rats are shown as groups. The data points from Intact rats are the same in both A and B. *P < 0.05 vs. Intact SOL and Intact TA, and nonsignificant (NS) vs. each other. **P < 0.05 vs. Intact TA, and NS vs. Intact SOL.

