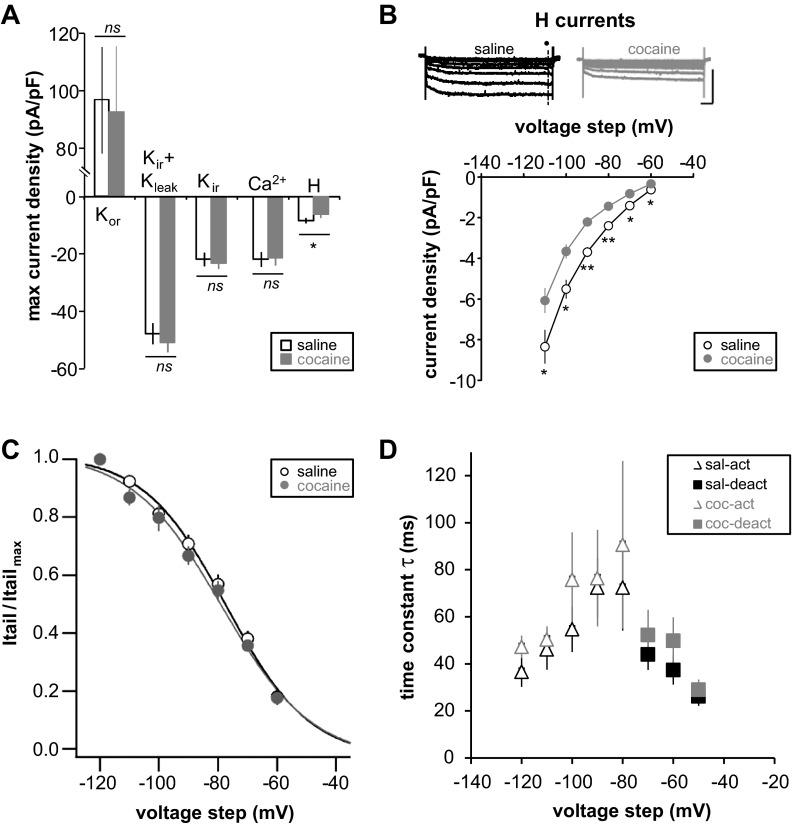
Fig. 4.
Repeated cocaine injection followed by long-term withdrawal alters H-current. A: maximum current density of each studied current. B: representative traces of membrane currents of FS-IN from repeated saline- (black) or cocaine-treated animals (gray). H-currents were isolated by subtracting traces obtained in 20 μM ZD 7288 from control traces [holding potential (Vholding) = −50 mV, step from −60 mV to −120 mV, 10-mV increments] (saline,n = 14, 3 rats; cocaine, n = 17, 4 rats). Current densities, calculated by dividing the amplitude of each steady-state current (dark circle) by membrane capacitance, are plotted against each test potential. Scale bars: 100 ms/200 pA. C: activation curves from repeated saline- (black) or cocaine-treated animals (gray). Itail, tail current; Itail max, maximum tail current. D: H-current kinetics from repeated saline- (black) or cocaine-treated animals (gray). The mean activation (open triangle) and deactivation (filled square) time constants are plotted against the voltage step command. Significant difference: *P < 0.05, **P < 0.01. ns, Not significant.

