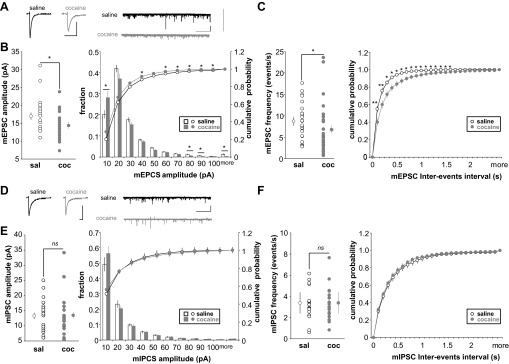
Fig. 6.

Amplitude and frequency of miniature excitatory postsynaptic currents (mEPSCs) and miniatures inhibitory postsynaptic currents (mIPSCs) in FS-IN following long-term cocaine withdrawal. A: average mEPSC (scale bars: 5 ms/10 pA) and sample traces of mEPSCs (scale bars: 10 s/10 pA) recorded in saline (black) or cocaine-injected (gray) rats. Graph is shown for pooled data values and graph plotting cumulative probability of mEPSC amplitude (B) and frequency (C) (saline, n = 25, 4 rats; cocaine, n = 26, 5 rats). D: average mIPSC (scale bars: 5 ms/10 pA) and sample traces of mIPSCs (scale bars: 10 s/10 pA) recorded in saline (black) or cocaine-injected (gray) rats. Graph is shown for pooled data values and graph plotting cumulative probability of mIPSC amplitude (E) and frequency (F) (saline, n = 20, 3 rats; cocaine, n = 19, 3 rats). Significant difference: *P < 0.05, **P < 0.01.
