
Figure 5. Effective qubit temperature vs. resistor temperature.
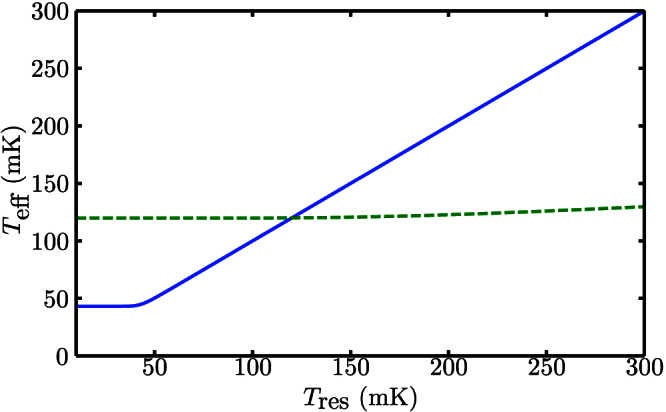
Effective temperature of the qubit as a function of the temperature of the resistor, which may be manipulated using SIN tunnel junction thermometry. The results are shown for bare left-cavity frequencies of  (solid line) and
  (dashed line) resulting in zero-temperature relaxation rates of 9.59 × 10⁹ s−1 and 1.01 × 10⁵ s−1, respectively. The frequency
  is selected to yield the maximum decay rate for the qubit–like eigenstate. In calculating the total excitation and de-excitation rates, we include an intrinsic qubit relaxation rate of
  , and excitation rate of
  , to give an intrinsic qubit temperature of Ti = 120 mK. The parameters are otherwise identical to those used in Fig. 3.