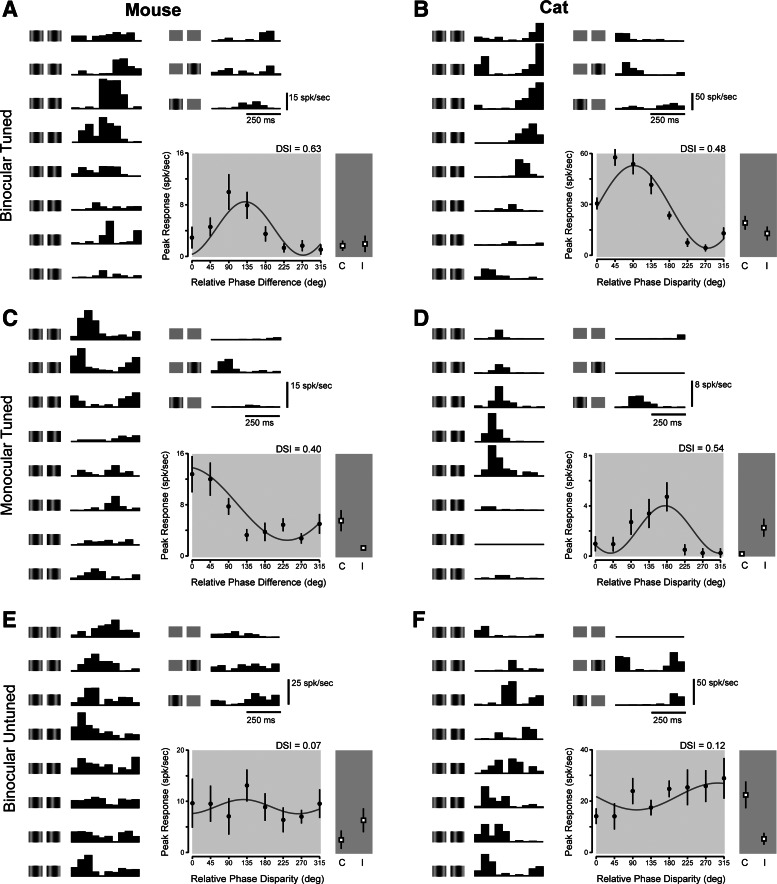
Fig. 3.
Simple cell disparity selectivity in mouse and cat. A: binocular neurons in mouse V1 show a modulation of peak response to different spatial phase combinations of binocular stimuli. Binocular cycle-averaged responses are shown at left. Illustration of each stimulus condition is shown next to each response. Spontaneous activity and monocular responses are shown at right. Binocular tuning is plotted from peak response amplitudes of binocular responses (black dots) alongside monocular responses (squares). C indicates contralateral stimulation alone, and I indicates ipsilateral stimulation alone. B: same as in A for a neuron in cat V1. C: same as in A for a monocular neuron. D: same as in C for a neuron in cat V1. E: neurons in mouse V1 show no modulation in response amplitude despite responding to stimulation of either eye. F: same as E for a neuron in cat V1. DSI, disparity selectivity index.

