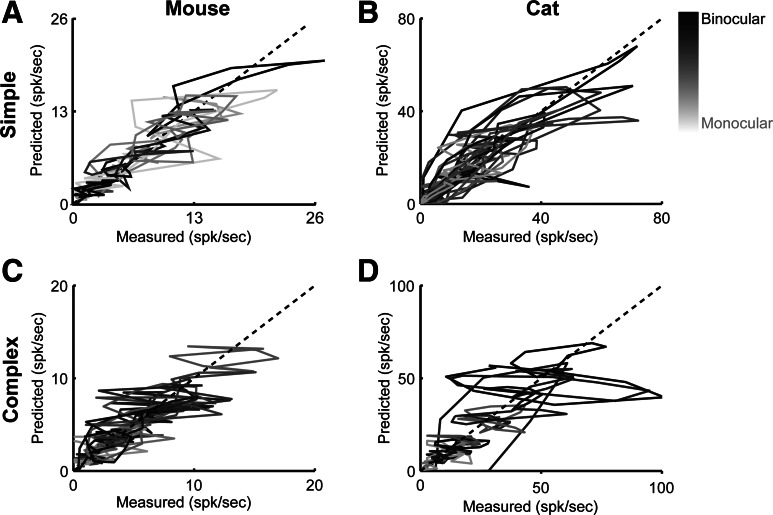
Fig. 7.
Relationship between predicted and measured binocular responses. A simple linear-threshold model predicts binocular responses across simple cells recorded in mouse (A and C) and cat (B and D). Each cell is plotted and shaded relative to binocularity measured by monocular stimulation (absolute value of ODI). Dashed line represents unity.

