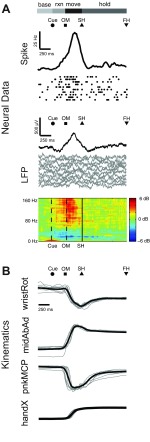
Fig. 3.
Neural and kinematic activity during reach and grasp. A: time-averaged traces of spiking activity, LFP amplitude, and LFP power for a representative single unit and LFP channel recorded from the same electrode, averaged across all correctly performed trials for 1 movement type in 1 session (monkey X: pushbutton in session X0918). Ten individual trials of spiking activity are shown as dot rasters directly below the histogram of spiking activity (black trace). Ten trials of LFP activity (gray traces) are shown directly below the average LFP amplitude (black trace). B: time-averaged traces of selected joint angles from the wrist (wristRot, wrist rotation) and fingers (midAbAd, middle abduction/adduction; pnkMCP, pinky metacarpal) as well as hand centroid position (handX, average of palm markers in x-dimension). Ten individual trials of kinematic data (gray traces) are shown overlaid with the average activity (black trace) for each degree of freedom (DoF). The average time of cue presentation (Cue), onset of movement (OM), start of static hold (SH), and final hold completion (FH) are indicated by symbols above each set of traces. Horizontal bars depict the behavioral states delimited by these event markers: baseline (base), period 300 ms prior to Cue; reaction (rxn), period from Cue to OM; movement (move), period from OM to SH; hold, period from SH to FH. For each DoF, the kinematic data were normalized to zero mean and unit standard deviation across all trials. All trials were aligned at SH.

