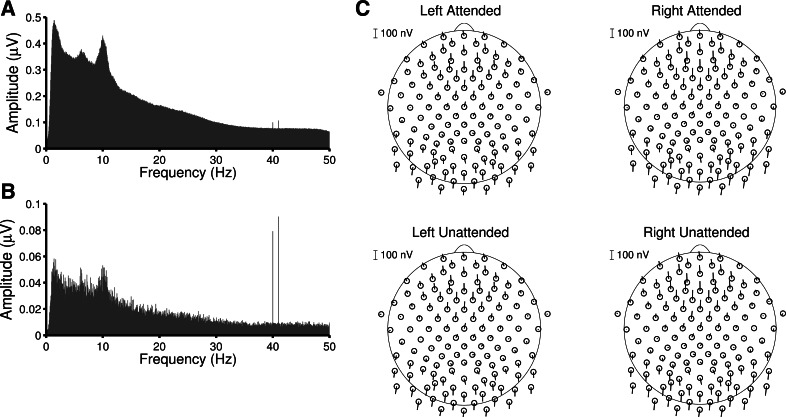
Fig. 4.
A: grand-averaged amplitude spectrum of frontal channel Fz, showing that the steady-state responses at 40 and 41 Hz are small but visible in individual trials. B: the complex Fourier coefficients for each trial can be averaged to reduce the contribution of all activity that is not phase-locked across trials. The steady-state responses are preserved, while all other activity falls off. C: polar plots showing the amplitude (length) and phase (angle) of the steady-state responses. Channels located outside the ring are located below the plane formed between the nasion and occipital channels O1 and O2.

