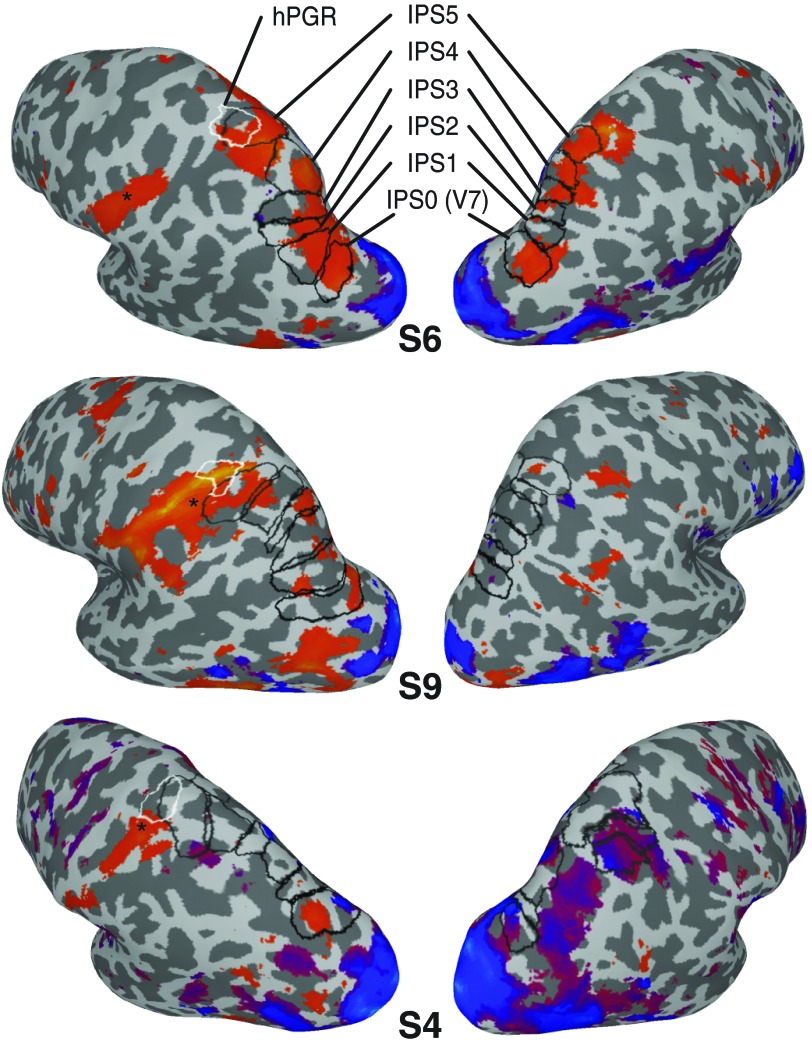
Fig. 2.
Statistical parametric maps from the analysis of the tool-animal localizer for 3 representative subjects (S6, S9, and S4). Greater responses to images of tools (orange) or animals (blue) are presented on inflated cortical surfaces for each subject (P < 0.01). Asterisks denote the significance peak of the contrast. Topographic regions of the IPS are outlined in black (IPS0–IPS5, posterior to anterior), and the human parietal grasp region (hPGR) is outlined in white. Although the extent of activation varied across subjects, there was a consistent tool-specific region located in the left anterior IPS, extending lateral, anterior, and inferior to IPS5 and lateral and inferior to hPGR. In addition, all subjects showed a response bias for tool images in more posterior topographic regions of the IPS (e.g., IPS0). No consistent response patterns were observed in the right hemisphere.

