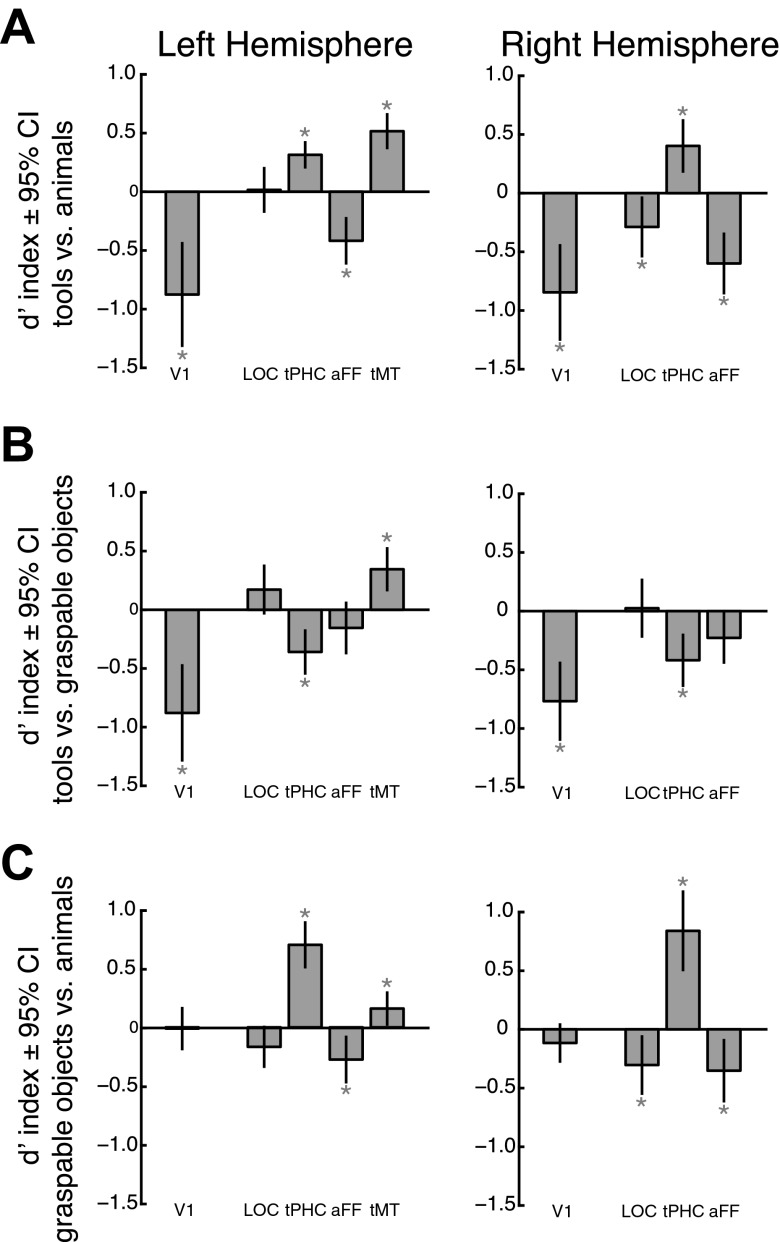
Fig. 6.
Pairwise comparisons of the differences between mean activation evoked by the 3 intact stimulus categories using a d′ index for early visual and occipital-temporal cortex ROIs. Conventions are the same as in Fig. 5. In occipital-temporal cortex, the comparison of tools and animals (A) confirmed the specificity of the functionally defined ROIs from the tool-animal localizer. LOC showed only slight differences across stimulus category in the left hemisphere and a bias for animals in the right hemisphere. Primary visual cortex displayed the weakest response to images of tools, consistent with its sensitivity to retinotopic image size. *P < 0.05, significantly different from zero.

