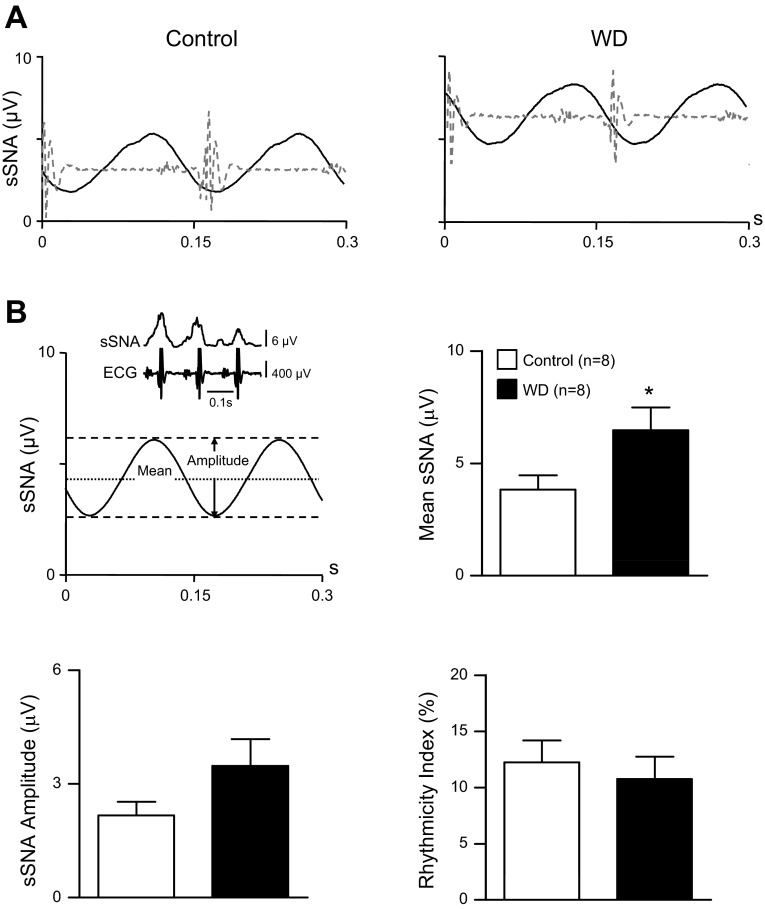
Fig. 3.
Effect of water deprivation on cardiac rhythmic sSNA. A: representative ECG R-wave-triggered averages of sSNA from a control (left) and 48-h WD (right) rat. Data are from the same rats as in Fig. 2A. Timing of the cardiac cycle is indicated by superimposed ECG traces (shaded dashed lines). B: the top left shows characteristic features of cardiac rhythmic sSNA. Examples in A show that, whereas mean sSNA voltage was greater in the WD than the control rat, cardiac rhythmic sSNA oscillation amplitudes were similar. Summary data (n = 8/group) (top right) show that mean voltage from R-wave-triggered sSNA averages was significantly greater in WD rats (solid bar) compared with euhydrated controls (open bar). However, cardiac rhythmic sSNA oscillation amplitudes were not different across groups (bottom left). Cardiac rhythmicity index values (bottom right) indicate that overall cardiac modulation of sSNA was unchanged by water deprivation. Collectively, results likely reflect similar levels of MAP and HR in control and WD rats (see Table 1). Triggered averages of sSNA in A were constructed using ∼1,600 consecutive R-waves. Summary data are means ± SE. *P < 0.05 vs. control.

