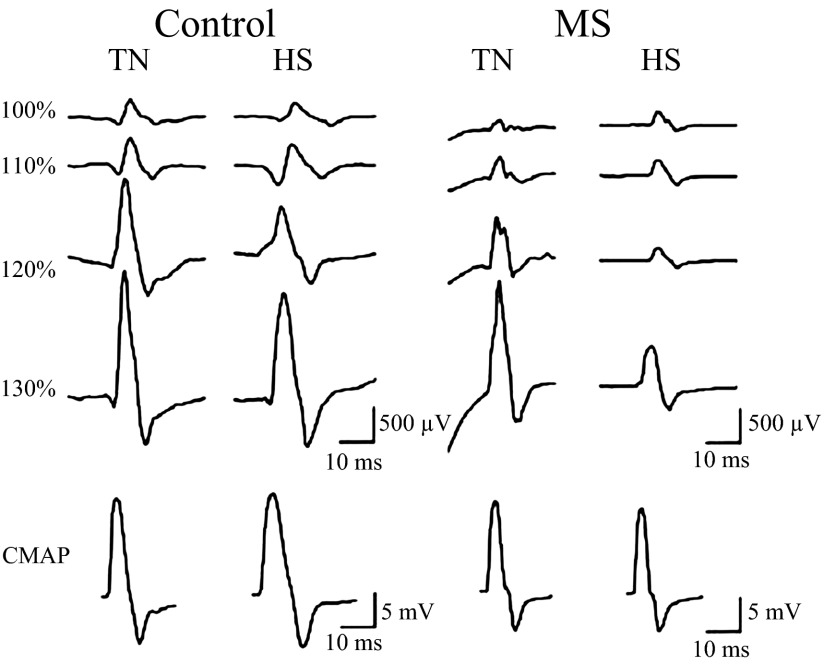
Fig. 3.
Representative motor-evoked potentials (MEPs) for a healthy control and MS patient during TN and HS conditions at 100, 110, 120, and 130% resting motor threshold (RMT). The row on the bottom shows corresponding baseline compound muscle action potential (CMAP) traces (different scale indicated). In this example, stimulus artifacts were evident in the MS patient during the TN condition. In general, these effects were not specific to any group or treatment and resolved before the MEP.

