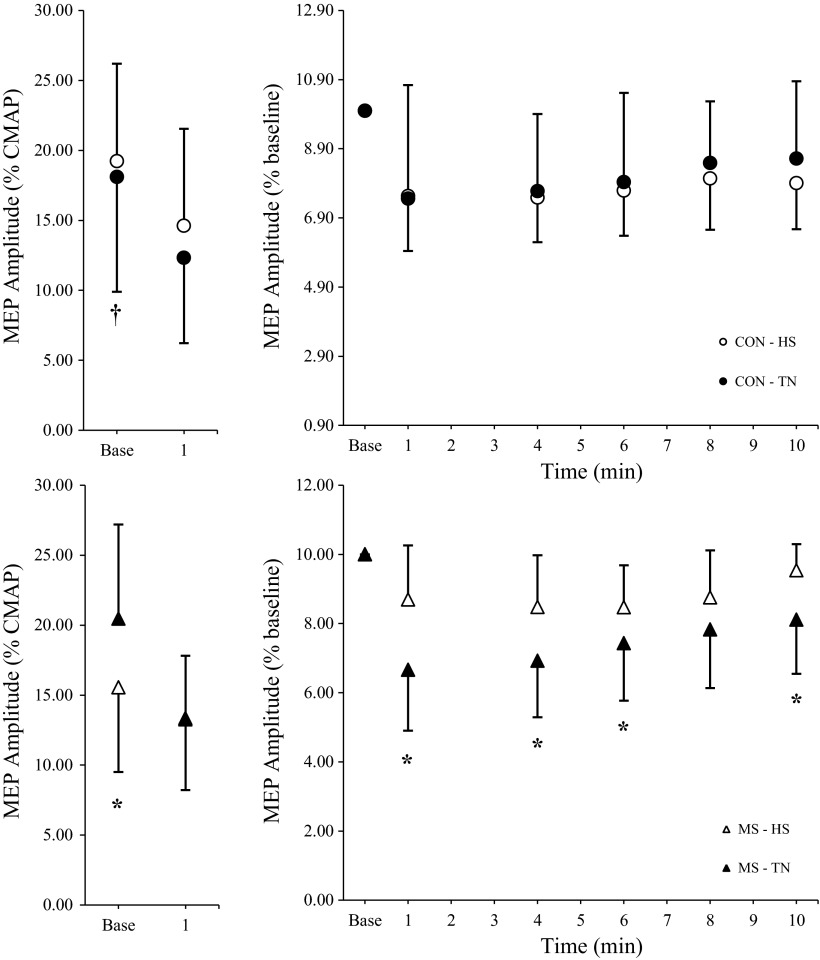
Fig. 5.
Baseline and 1-min postfatigue task group differences in MEP amplitudes (MEPamp, left) for healthy controls (top) and MS patients (bottom). Postexercise changes in MEPamp relative to baseline (right) indicate no treatment (HS vs. TN) differences for controls (top) and significantly smaller relative changes in MS patients during HS compared with TN (bottom). *Significant within-group treatment effect, P < 0.05. †Significant between-group difference across treatments, P < 0.05.

