Fig. 4.
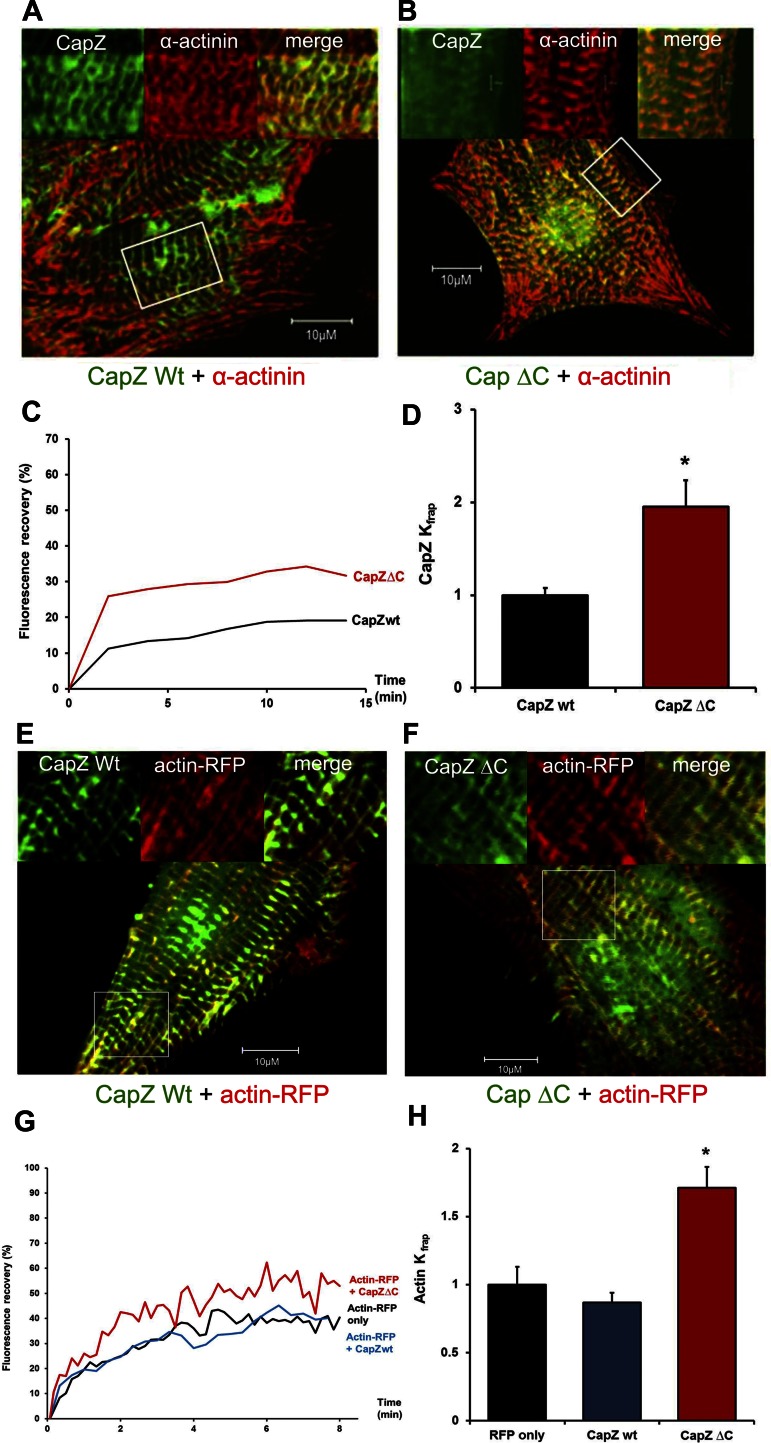
NRVMs expressing CapZβ1ΔC-GFP have higher CapZ and actin dynamics than wild-type CapZβ1-GFP. A and B: GFP and α-actinin antibodies show colocalization of both the wild-type and the mutant CapZβ1-GFP to the Z-disc. Boxed areas in whole cell are enlarged in insets. C: FRAP of wild-type CapZβ1-GFP (black line, CapZwt) or COOH-terminal deletion CapZ (red line, CapZΔC) as a percentage of prebleach intensity. D: Kfrap values normalized to unstrained cells have higher dynamics for CapZβ1ΔC-GFP (red bar, n = 4) compared with wild-type CapZβ1-GFP (black bar, n = 4). E and F: confocal images show localization of CapZ and its mutant at the Z-disc, and actin-RFP localization adjacent to Z-disc in the I-band. G: actin-RFP FRAP alone as a percentage of prebleach intensity in cells (black line, actin-RFP), or actin-RFP also expressing either CapZβ1-GFP (blue line, actin-RFP + CapZwt), or expressing the COOH-terminal deletion CapZ (red line, actin-RFP + CapZΔC). H: Kfrap values normalized to the cells expressing actin-RFP alone (n = 4) show a higher recovery rate of actin-RFP in the cells expressing CapZβ1ΔC-GFP (red bar, n = 5) than the cells expressing wild-type CapZβ1-GFP (blue bar, n = 5). Values are means ± SE. *Significant difference (P < 0.01).

