Figure 1.

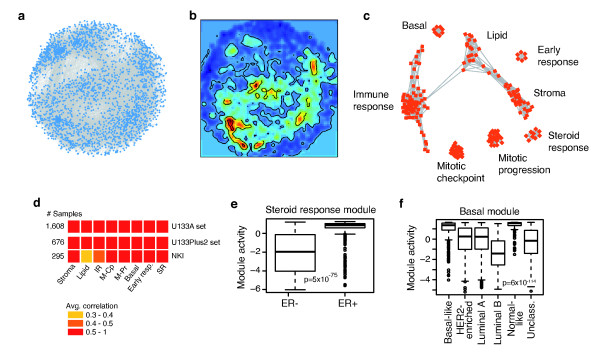
A breast cancer gene expression network. (a) Genes (represented as blue squares) with pair-wise gene expression correlations above 0.3 in a dataset representing 1,608 breast cancer samples were connected by edges and visualized using network graphics. Genes with less than five connecting edges were removed to extract a highly interconnected network. The network is complex and hard to interpret, even though all connections are statistically significant. (b) Although the network is dominated by regions of lower correlations (blue), there are regions in which genes are connected by higher correlations (red). (c) By restricting the analysis to genes with correlations above 0.6, a network of eight visually distinct modules reflecting the high correlation areas in (b) was extracted. In this way, the complex network in (a) could be reduced to a network with gene modules related to tumour biological themes. (d) Correlation-based modules were verified by assaying co-expression in independent breast cancer gene expression datasets. All pair-wise Pearson correlations between genes within modules were calculated across all samples for two additional breast cancer datasets representing 676 and 295 samples, respectively. The mean correlation for each module, as depicted by colored boxes, was used as a measure of module co-expression reproducibility. M-Pr, mitotic progression; M-Cp, mitotic checkpoint. (e, f) Module expression acts as surrogate markers for breast cancer molecular characteristics. (e) SR activity is high in ER-positive, but also in some ER-negative tumors. (f) Basal module activity is high in basal-like and normal-like tumors.
